DecisionPoint
About DecisionPoint
DecisionPoint Pricing
Starting price:
$40.00 per month
Free trial:
Available
Free version:
Not Available

Other Top Recommended Business Intelligence Tools
Most Helpful Reviews for DecisionPoint
1 - 5 of 12 Reviews
Anonymous
1,001-5,000 employees
Used weekly for more than 2 years
OVERALL RATING:
5
EASE OF USE
4
FUNCTIONALITY
4
Reviewed April 2019
DecisionPoint provides excellent metrics and integration capabilities
Overall, DecisionPoint is a must have for any mid - large organization that uses metrics to drive customer satisfaction up.
PROSLove the integration with Salesforce. We are able to pull just about any metric we need from our CRM application and reporting on everything from cases created, closed, to case minutes and survey responses. DecisionPoint allows us to establish a consistent metric reporting report out of the box, to the whole organization both weekly and monthly. It is very easy to update job levels and add/remove individuals from the reporting list. We consistently leverage the export to excel functionality to create our own report templates / designs with the data.
CONSWould like the ability to auto report daily and have summary sent in a unique format as this would automate some of the manual reporting elements that management must conduct.
Matt
Construction, 1,001-5,000 employees
Used monthly for more than 2 years
OVERALL RATING:
4
EASE OF USE
4
VALUE FOR MONEY
3
CUSTOMER SUPPORT
4
FUNCTIONALITY
3
Reviewed June 2017
Good product but dashboards
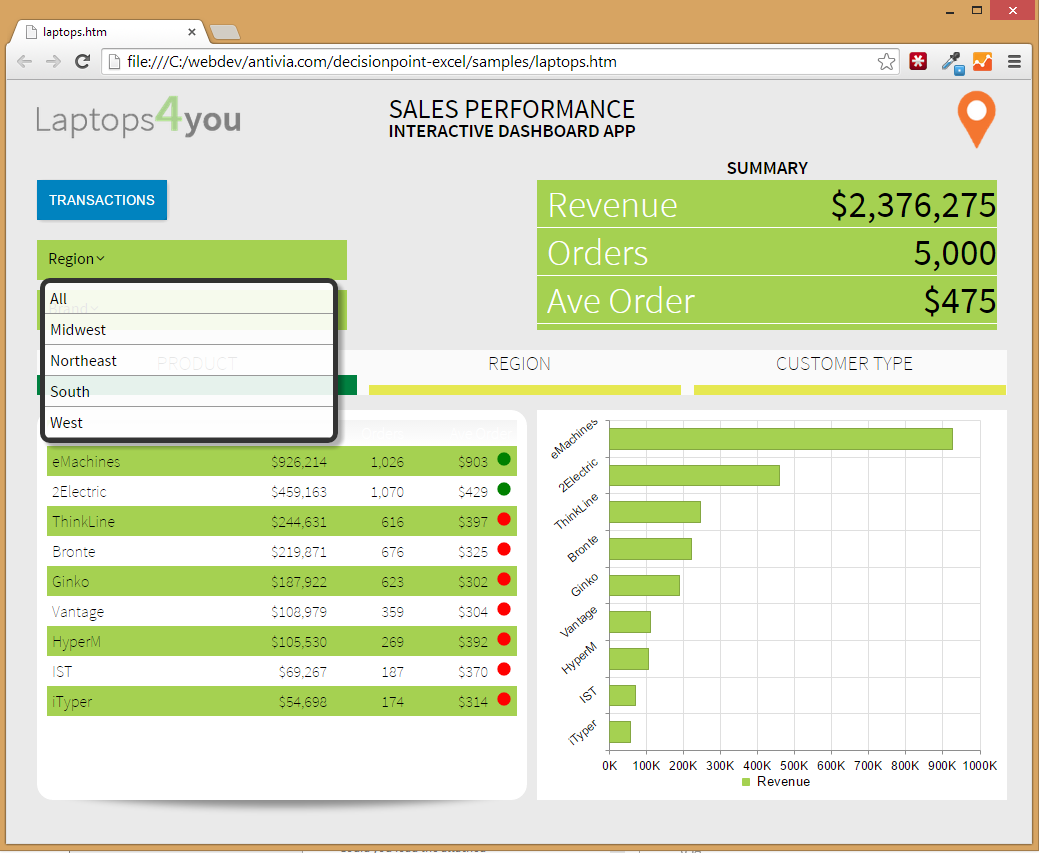
Effective visualisations of our data
PROSTo use standard visualisations out of the box its quick and provides a quick way to delivery immediate analysis
CONSYou cant always customise the standard visualisations enough and the dashboard doesn't scale effectively to all screen sizes
Vendor Response
Hi Matt, Thanks for your feedback and good to hear that DecisionPoint is helping you deliver business value, quickly at Willmott Dixon. We're continuing to enhance DecisionPoint and we've just added extra functionality to give you more control over charts in version 5.1 (with more to come and working with different device form factors is an area our R&D team is looking into. Best Regards, Bryan - Antivia
Replied June 2017
Apurva
Food & Beverages, 501-1,000 employees
Used daily for less than 12 months
OVERALL RATING:
3
EASE OF USE
3
VALUE FOR MONEY
4
CUSTOMER SUPPORT
5
FUNCTIONALITY
3
Reviewed June 2017
A good tool to create simple dashbaords
Dashboards provide much needed visibility into Operations
PROSEasy to use for developing simple operational dashboards. Works well with dashboards that need to be displayed on large screens.
CONSnot suited for large data volumes and complex self-service analysis needs, where we need to resort to tableu or powerbi
Vendor Response
Hi Apurva, Many thanks for the review and good to hear you are getting value from DecisionPoint delivering your operational dashboards. There are several ways we can work with larger data volumes including delegating drill and filter to either the server or the database and supporting parameterized queries. I'll ask one of our product specialists to reach out to you to offer you some help in this area. Best Regards, Bryan - Antivia
Replied June 2017
Mary Love
Food & Beverages, 51-200 employees
Used weekly for less than 2 years
OVERALL RATING:
4
EASE OF USE
4
FUNCTIONALITY
4
Reviewed August 2018
Good dashboard
As an excel user for years now, this extra tool gives us the edge of analyzing the flow of business in a simple but deeper way.
CONSMaybe if they could include some features like the alarm or include the pareto principle for the chart.
Allison
Computer Software, 2-10 employees
Used less than 12 months
OVERALL RATING:
4
EASE OF USE
3
FUNCTIONALITY
4
Reviewed November 2017
Excellent Product
Overall, I find this a very effective software product - easy to use, great support if you need it, and is a smooth and fluid solution to create interactive dashboards.
PROSThis product is very easy to use, it's intuitive and easy to set up and get going. I found the process to converting and moving data easy.


