Tableau
About Tableau
Tableau Pricing
For Individuals Tableau Creator: $70 USD/user/month, billed annually For Teams & Organizations (On-premises or public cloud) Tableau Creator: $70 USD/user/month, billed annually Tableau Explorer: $35 USD/user/month, billed annually Tableau Viewer: $12 USD/user/month, billed annually | min. 100 Viewers required Fully hosted by Tableau Tableau Creator: $70 USD/user/month, billed annually Tableau Explorer: $42 USD/user/month, billed annually Tableau Viewer: $15 USD/user/month, billed annually | min. 100 Viewers required
Starting price:
$75.00 per month
Free trial:
Available
Free version:
Available

Most Helpful Reviews for Tableau
1 - 5 of 2,244 Reviews
Gaurav
Higher Education, 1,001 - 5,000 employees
Used more than 2 years
OVERALL RATING:
4
Reviewed November 2020
The easiest tool for Dataviz
Shishir
Verified reviewer
Information Technology and Services, 501-1,000 employees
Used daily for more than 2 years
OVERALL RATING:
5
EASE OF USE
5
VALUE FOR MONEY
5
CUSTOMER SUPPORT
4
FUNCTIONALITY
5
Reviewed June 2019
Excellent tool for Data Visualization with simplicity
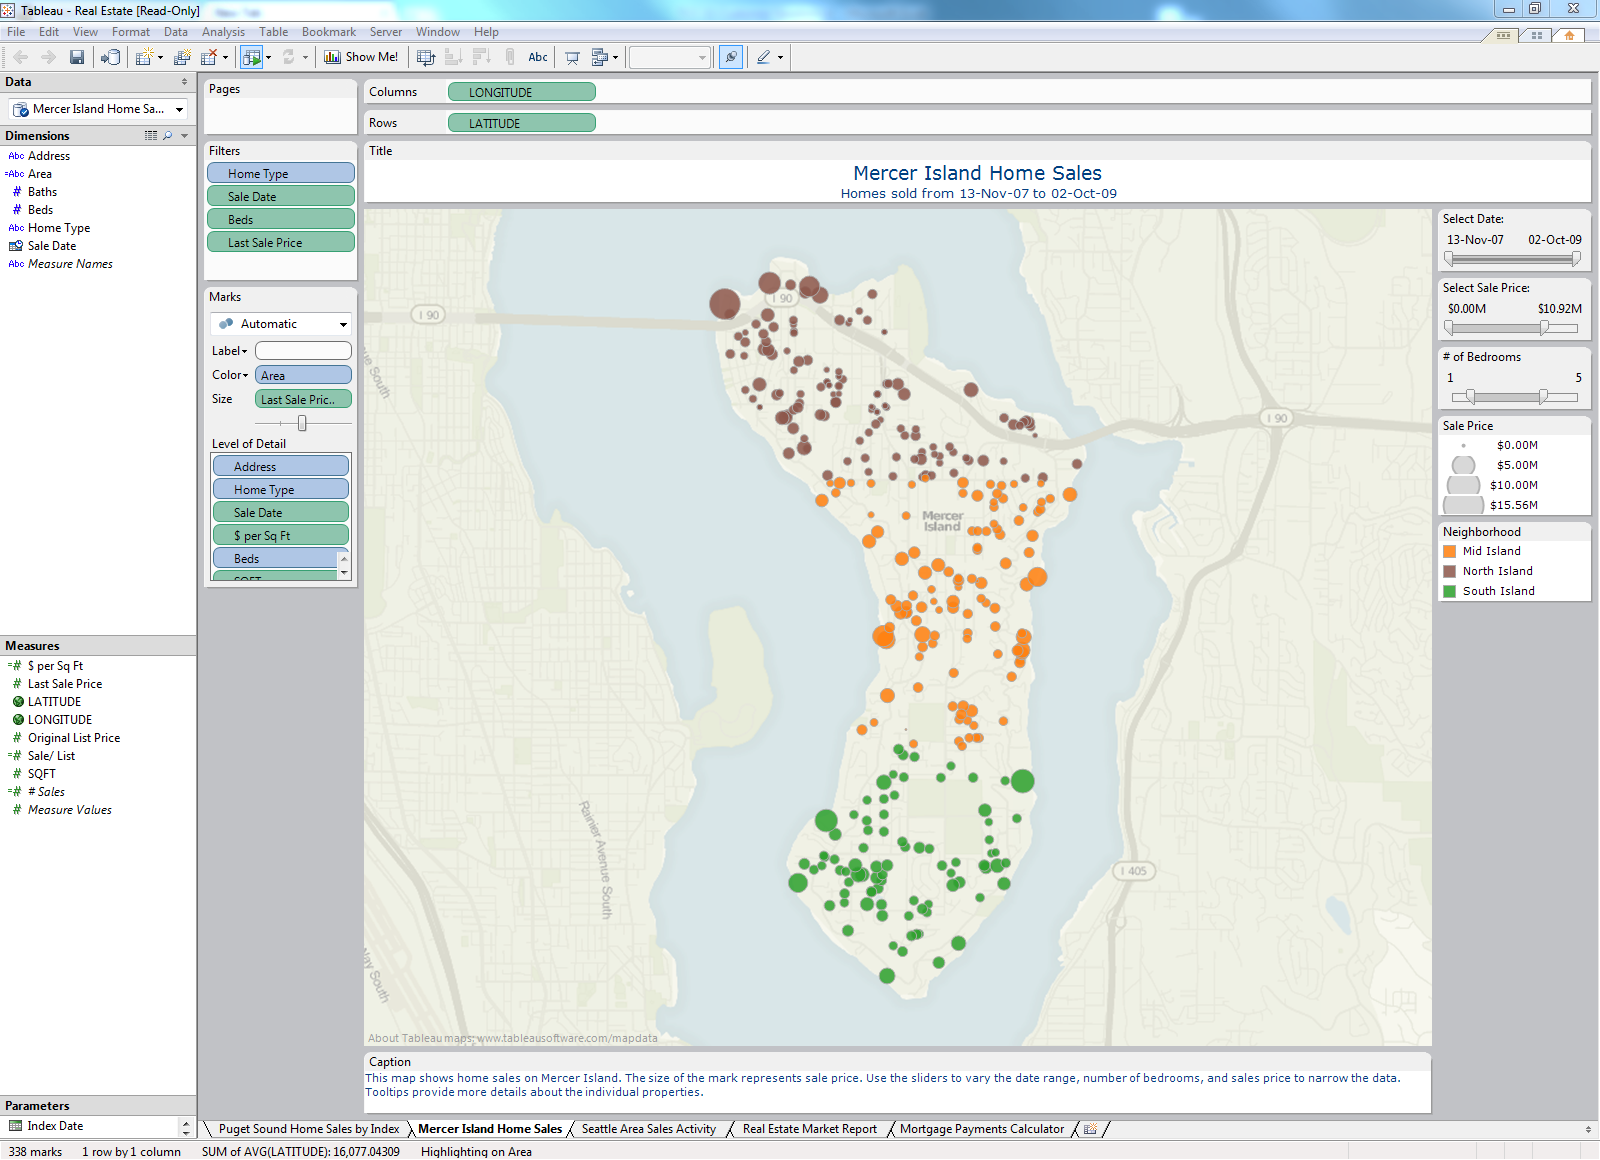
I have worked on domains like Telecom and Network where in I have been using Tableau. Its really liked by senior management as it shows each and every bit very clearly to relevant stake holders. For example, Marketing head likes region wise revenue sale dashboard which gives region/sales manager/product wise sale.
PROSThere are many features which lot of users would have liked:- 1. Connection to almost all database 2. Many types of Charts can be created including Sankey, Doughnut, Maps etc. 3. Its has the feature of data blending and data extraction 4. Dashboards can be viewed on multiple devices like tablet, mobile and laptops. 5. Its really fast while drilling down or filtering out from any dashboard.
CONSIts a bit expensive tool as compared to other data visualization tools however its a value for money.
Reason for choosing Tableau
There were multiple check points before choosing Tableau:- 1. We refereed Gartner quadrant which showcased good image of tableau. 2. Reviews taken from friends who are working in other organisation. 3. Some POCs developed on Trail version of Tableau
Reasons for switching to Tableau
It was a organisation demand however but as and when I started working on Tableau, I really liked working on it.
Caroline
Verified reviewer
Computer Software, 1,001-5,000 employees
Used daily for less than 2 years
OVERALL RATING:
4
EASE OF USE
4
VALUE FOR MONEY
5
CUSTOMER SUPPORT
5
FUNCTIONALITY
5
Reviewed August 2023
User-friendly dashboard/report Tool
Tableau is amazing software that has greatly aided our data analysis efforts. Tableau meets all of our needs for data analysis and dashboard creation. The nicest element is that direct use of ad hoc data needs is possible, with no dependencies.
PROSOne of the most useful features of Tableau is the flexibility with which its dashboards may be filtered. Information that is simple to understand, demonstrate, and infer. Any group may quickly and simply extract useful data thanks to a drag-and-drop interface.
CONSData syncing problems can cause the dashboards to malfunction. Notifications about impending outages would be greatly appreciated. however, that shouldn't be a deal breaker.
Reasons for switching to Tableau
Tableau offers an intuitive layout and straightforward menus, making it suitable for newcomers. Tableau is an effective business program with data visualization features and compatibility with other popular software packages.
Brian
Logistics and Supply Chain, 201-500 employees
Used weekly for more than 2 years
OVERALL RATING:
5
EASE OF USE
4
VALUE FOR MONEY
4
CUSTOMER SUPPORT
5
FUNCTIONALITY
5
Reviewed February 2024
Tableau - Great for Driving change within an organization
Ease of Use and ability to go from data to visuals within minutes
CONSlack of statistical analysis tools, formatting table visuals is cumbersome
Anonymous
51-200 employees
Used weekly for more than 2 years
OVERALL RATING:
3
EASE OF USE
3
VALUE FOR MONEY
2
CUSTOMER SUPPORT
4
FUNCTIONALITY
4
Reviewed September 2022
Amazing for data analysis and exploration, not great for dashboards
At my team we use Tableau as a data exploration tool for data practitioners, and not for dashboards and data reporting to the company. This setup takes advantage of what Tableau does best and don't use it for what it doesn't. Tableau as a data reporting and dashboard tool may be suited for more traditional organizations, with a lot of experienced BI personnel who can take the time to build good dashboards with it.
PROSTableau allows for very good exploratory data analysis, and one can build amazing visualizations with it. Once you learn how to work with it, it becomes very easy to explore data and get insights from it.
CONSTableau is very expensive compared to its competitors, and if you want to get the whole company using it for dashboards, the pricing is certainly prohibitive for startups. I also don't Tableau for Dashboards, as the discovery and navigation interface is not very inviting to business users and dashboards are hard do discover. At the same time, building dashboards on Tableau is a lot less straightforward than in other tools. One can build very advanced dashboards, but that requires a lot of time and expertise, which not all Data users in a company will be.


