Top 5 Benefits of Using Gantt Charts for Project Management
In our 2015 analysis of PM software buyers who contact Software Advice, nearly 90 percent request a platform with project planning capabilities.
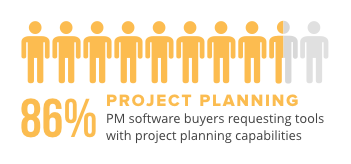
Yet despite the high number of project planners looking to automate this function, a recent survey shows that a significant number of project management professionals still perform a key aspect of project planning using manual methods—creating and maintaining Gantt charts (see last section).
Gantt charts are a valuable tool to have in your project planning arsenal. Managers use them to perform a variety of project management (PM) functions, including:
Visualize the critical path.
Set baselines for project scope, budget and schedule—three metrics that are later used to measure project success.
Track project progress after kickoff.
To help buyers better understand how automated tools can fit into their workflows, we spoke to PM professionals and put together the following list of benefits these users have experienced.
In this article, you’ll learn how using automated Gantt charts for project management can benefit your team and hugely impact your project success.
Here’s what we’ll cover:
How Can Automated Gantt Chart Tools Benefit Project Teams?
Benefit #1: Complex Information Is More Manageable
Benefit #2: Team Productivity Is Enhanced
Benefit #3: More Effective Resource Planning
Benefit #4: Different Groups Stay on the Same Page
Benefit #5: Project and Team Requirements Are Clear
Considerations for Evaluating Automated Gantt Chart Tools
How Can Automated Gantt Chart Tools Benefit Project Teams?
A Gantt chart is a PM tool that is used for two critical stages of the project life cycle: planning and tracking. The charts are a visual representation of the project schedule, with tasks displayed as horizontal bars across a calendar.
The most common PM actions performed using Gantt charts include:
Visualize schedule
Assign due dates to tasks
Assign staff to tasks
Identify the critical path
Track progression of work items
Some of the defining capabilities that distinguish automated tools from manual Gantt charts, and that make them so valuable when performing the above activities, include:
Color-coding | To represent different task attributes, such as who is responsible for completing it (e.g., all Tim’s tasks are blue, or all developer tasks are yellow). |
Shading | To represent how much work has been completed on the task (e.g., a task 50 percent complete is halfway shaded). |
“Linking” dependent tasks | Allows updates to cascade through the schedule when changes are made to one of the linked tasks. |
Drag-and-drop | Allows users to easily move a task to adjust the schedule. Due dates on subsequent tasks are automatically updated. |
Easily hide or show task details | Users can click or hover over a task to view details, such as the task start date, projected end date, percent complete and who is responsible for completing it. |
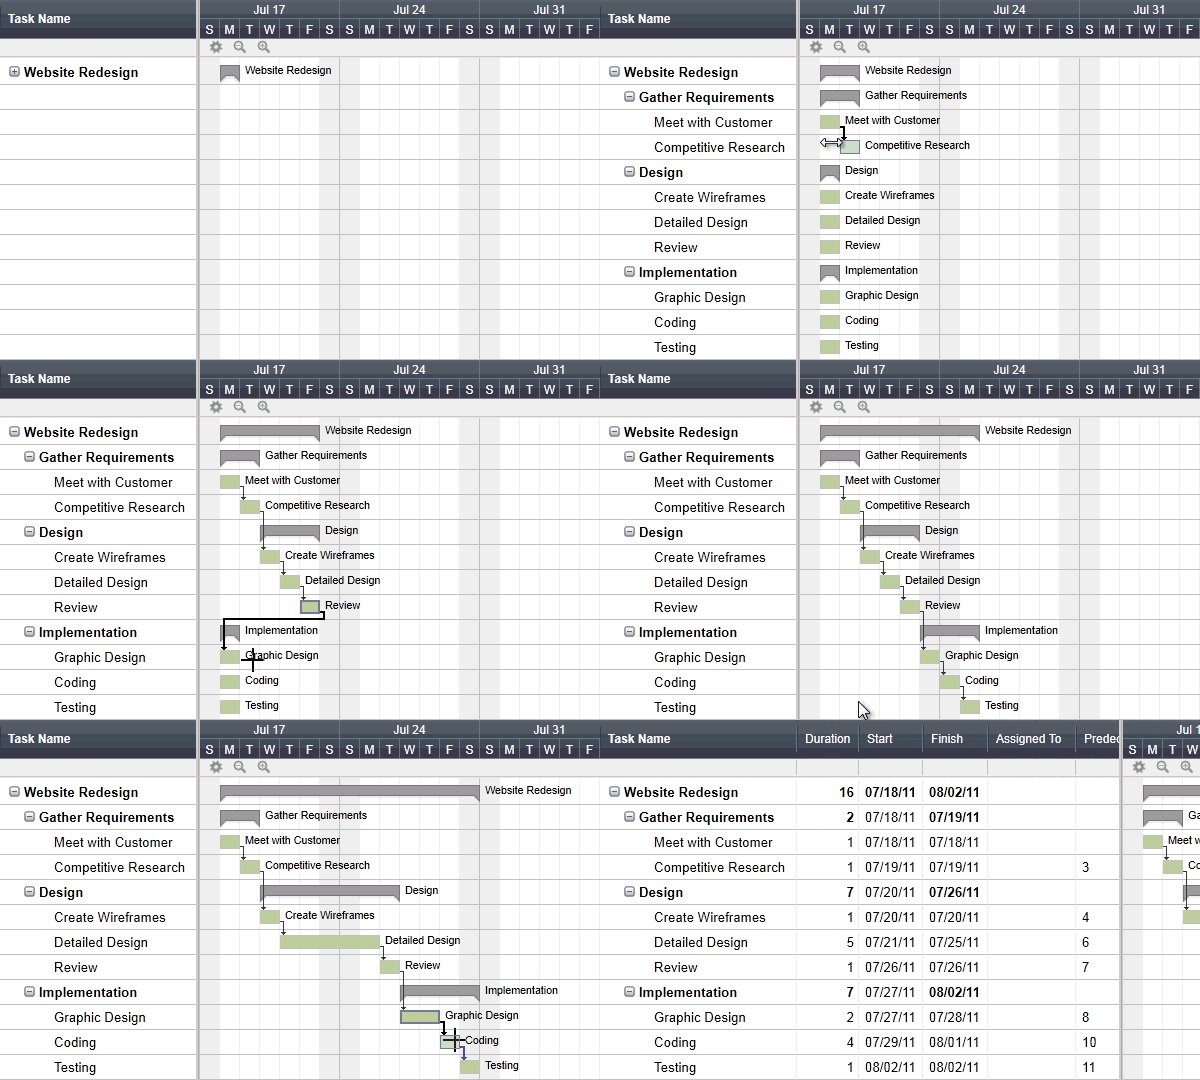

Creating a Gantt chart in Smartsheet
The following are several real-life benefits managers have experienced from using automated Gantt charts for project management.
Benefit #1: Complex Information Is More Manageable
Gantt charts make critical project information easily scannable. Users know at a glance:
Who on the team is going to complete the task
When they’re going to complete it by
How that individual task relates to the project as a whole
To convey this information, tasks are displayed as horizontal lines spanning certain portions of the timeline, and are color-coded to represent the employee or department they’re assigned to.
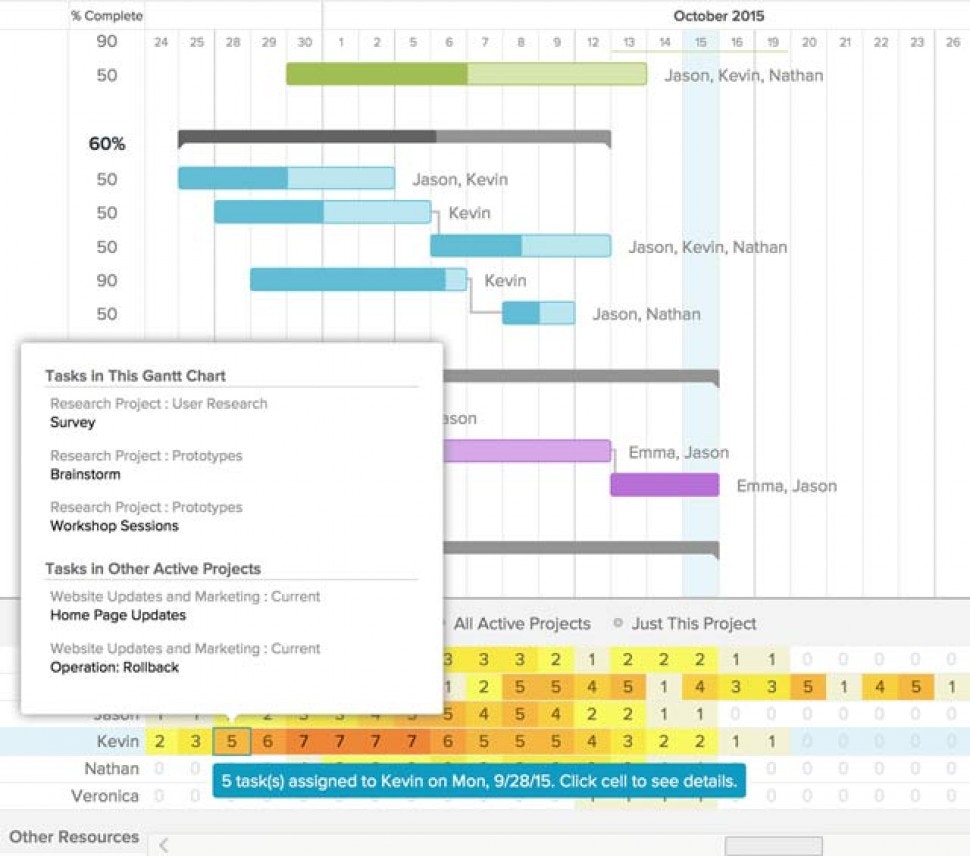

Gantt chart in TeamGantt
“It’s not just a chart that looks good,” notes Doug Cooper, founder of Trubelo Development, a business/creative development and PM consulting firm.”[Managers] can sort items or drill down into the data and interact with the data a lot more.”
KEY TAKEAWAY
Gantt charts make complex information more manageable because their visual nature makes it easy to comprehend detailed project information at a glance.
Benefit #2: Team Productivity Is Enhanced
Task assignment and progress information is displayed publicly—helping individuals stay on top of their own work while allowing team members to hold each other accountable.
Once a project has begun, Gantt charts display progress in several ways, including:
The task will be shaded, reflecting the “percent complete”
Users can hover over or click on a task to view additional details, such as “start date,” “end date” and “duration”
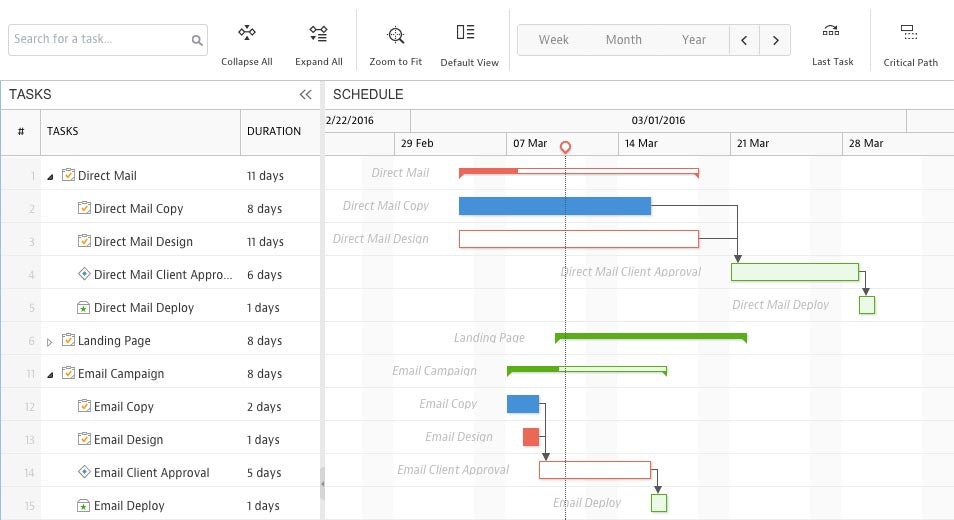

Gantt chart in Mavenlink
Additionally, some tools allow managers or administrators to schedule email or in-app alerts when a task is nearing its due date or if an activity is at risk of not being completed on time.
For example: If a task is two days away from deadline but is only 20 percent complete, both the manager and responsible party are alerted. This allows corrective measures to be enacted, such as reducing that individual’s workload or assigning another person to help.
By tracking progress publicly, Gantt charts can also serve as a motivational tool, according to Cooper.
“[Progress tracking] is not just to catch people when they slip, but can be used to help motivate teams to strive to achieve and complete the items they are responsible for,” says Cooper.
KEY TAKEAWAY
Gantt charts enable greater team productivity because they help individuals better manage their time, which in turn helps teams improve their overall performance.
Benefit #3: More Effective Resource Planning
Gantt charts allow managers to distribute work more effectively across resources because they can see both current and future project schedules mapped out across their respective timelines.
According to Leigh Anne Bishop, digital project manager at BrandExtract, this allows them to staff projects and split work more evenly across teams and between employees.
“We are able to see simultaneously the full scope of multiple projects,” says Bishop. “Managers [can] see when projects will be reaching their department, as well as understand the capacity of teams in other departments that they collaborate with.”
This allows Bishop and her peers to plan and manage effective work teams without overweighing certain employees with specific skill sets.


Viewing resources, by location, in Ganttic
Of course, Gantt charts aren’t the only scheduling tools managers use. Many PM platforms include resource management functionality that allows managers to assign staff to tasks and projects.
However, PM systems that include Gantt charts offer resource management functionality plus the visual project plan, giving managers additional insight into employee utility and availability.
KEY TAKEAWAY
Gantt charts make scheduling more effective because they help managers visualize their resource capacity. This allows them to mindfully allocate people to projects so key resources don’t become overworked.
Benefit #4: Different Groups Stay on the Same Page
Centralizing project information in a Gantt chart helps align different stakeholders, allowing them to easily share information and stay up-to-date with project changes.
Trubelo’s Cooper says Gantt charts are a great way to summarize complex project data for a varied audience, because users can choose to display only the information that’s most important to them.
For example, users can sort the chart to show either a broad view of milestones or more specific task details. Gantt charts are collapsible and expandable, allowing the user to choose their own appropriate level of detail.
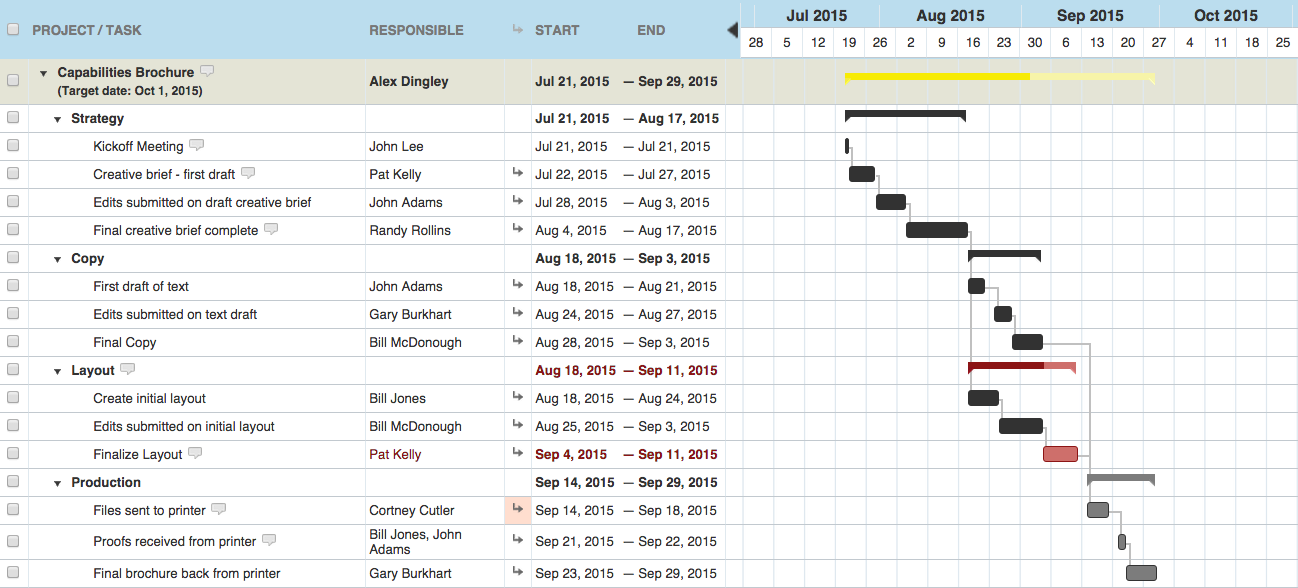

Gantt chart in WorkZone
Because of this quality, BrandExtract’s Bishop says that Gantt charts are their go-to tool for keeping teams on the same page, allowing multiple groups to get a quick snapshot of current progress.
“We are able to communicate effectively to multiple players at the same time,” says Bishop. “Since it’s a tool so easily understood by many people, it keeps us all on the same page.”

“Rather than having to use multiple organizational tools, the Gantt chart is as close as you can get to an everything for everyone tool.” Tweet this quote
Leigh Anne Bishop, digital project manager at BrandExtract
This is especially true when teams use cloud-based project management software, which automatically updates and reflects any changes made to schedules or requirements in real time.
Since cloud solutions allow any user to log in at any time from any compatible device, geographically scattered groups can be even more connected when using these systems.
KEY TAKEAWAY
Gantt charts help keep different groups on the same page by collating disparate project information into one tool and making it easy to share among different stakeholders.
Benefit #5: Project and Team Requirements Are Clear
Gantt charts help employees better understand their responsibilities and how their tasks relate to the entire project because tasks are displayed across a calendar.
This also helps managers and stakeholders determine project milestones—a process that’s especially important when milestones are tied to mid-project billing and invoicing.
“Gantt charts serve as a big picture ‘map,'” says Bishop. “This helps everyone attached to a project, from strategist to designer to developer, visualize how we’re going to get from the start to our end result.”
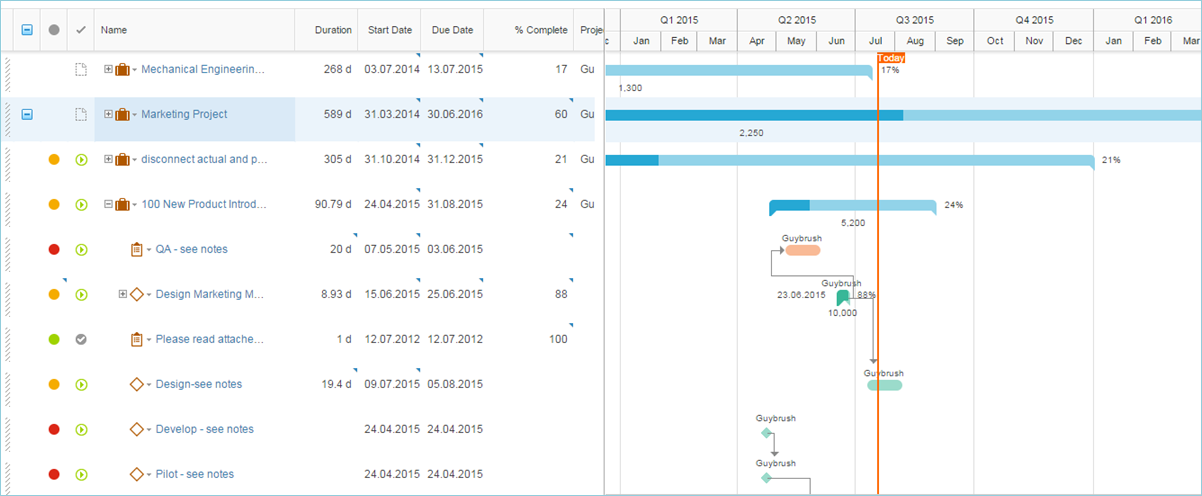

Interactive Gantt chart in Clarizen
This type of high-level “roadmapping” helps managers and stakeholders measure how much effort is required from each individual or each department. In turn, this allows them to more accurately determine the project’s scope, budget and timeline.
KEY TAKEAWAY
Gantt charts clarify project and team requirements by displaying tasks across a calendar, which helps highlight dependencies, key milestones and potential risk areas. Requirements are clearly laid out, and managers and employees know what they are responsible for.
Considerations for Evaluating Automated Gantt Chart Tools
If you’re considering investing in an automated Gantt chart tool, you have a few options—and not all of them have to break the bank. In fact, free, standalone Gantt chart tools are one of the more popular methods for users making the jump from manual tools (see chart below).
GanttProject is a free option that is a downloadable app for Windows, OS X and Linux. You can also find free versions of paid tools, such as TeamGantt, which offers more capabilities and support options than you have with a downloadable app.
If you’re looking for a paid, standalone tool, maybe to supplement your existing PM system, you again have several options. Cloud-based tools, such as GanttPRO and TIEMCHART, are often sold in tiers, so you can choose the package that’s right for your needs now, and advance to a higher tier when your needs change—for example, if you need more space or want to add more users.
Finally, many PM tools have a Gantt chart application built into the system. This includes popular systems, such as Wrike, Mavenlink and Smartsheet, all of which consistently rank as top products on our PM FrontRunners quadrant.
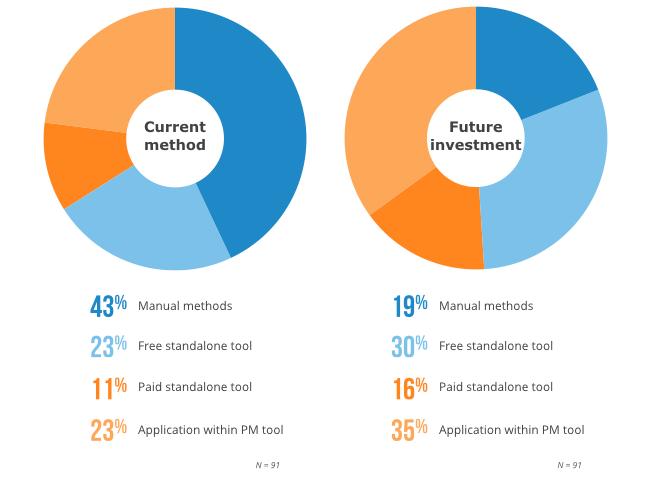
We surveyed project management professionals to find out what Gantt chart tools they currently use and how they plan to invest in the future.
Surprisingly, 43 percent of respondents say they create and maintain Gantt charts using manual methods, i.e., pen and paper or using a template in a spreadsheet tool like Excel or Google Sheets.
However, of these, just 19 percent say they plan to continue using manual methods. The other 24 percent would make the switch to automated Gantt chart tools.
A good portion would switch to a free, standalone Gantt chart tool. However, a larger percentage say they plan to invest in a PM solution with Gantt chart capabilities, for better integration and workflow.
Gantt Chart Users’ Current Tools vs. Plans for Future Investment
Next Steps
As noted above, Gantt charts are a useful planning tool that can help drive project success. If you’re looking to invest in a project planning software solution, here are three things you can do to help narrow your search:
Take our online PM questionnaire: The PM market is vast, and wading through hundreds of vendors is time-consuming. After answering a few questions, we’ll match you with up to five vendors whose products fit your project planning needs.
Speak to a Software Advice expert at (855) 998-8505: Sometimes there’s no substitute for a one-on-one consultation with a PM software specialist. Our unbiased experts can provide you with a list of Gantt chart software solutions to help drive your project success.
Read user reviews: Once you have a short list of products, read reviews from real users to find out how your peers have rated the platform for characteristics such as ease of use and customer support.