3 Critical Maintenance KPIs an Optimal CMMS Dashboard Should Have
Maintenance management involves many moving parts. To keep up with everything, each member of a maintenance team must enter accurate data each time they create a work order or perform a job.
Using operational data, a computerized maintenance management system (CMMS) can display key performance indicators (KPIs) on a reporting dashboard to visualize its performance.
With insights from software experts, engineers and maintenance consultants, this report will introduce the top three KPIs every company should track, and provide four tips for tracking them accurately over time.
Here’s what we’ll cover:
Top Three Critical Maintenance KPIs for Any Industry
For small companies, a manual approach can work, says Sandra Hawkins, senior research engineer at Southwest Research Institute and an experienced manufacturing consultant. She recommends companies seek software early on as they grow.
“The larger you get, you will want to look into software to make it easier to manage your open work orders and make sure preventive maintenance does get done,” she says.
With a CMMS, maintenance professionals can track the KPIs they need and even customize a dashboard to only display what they want.
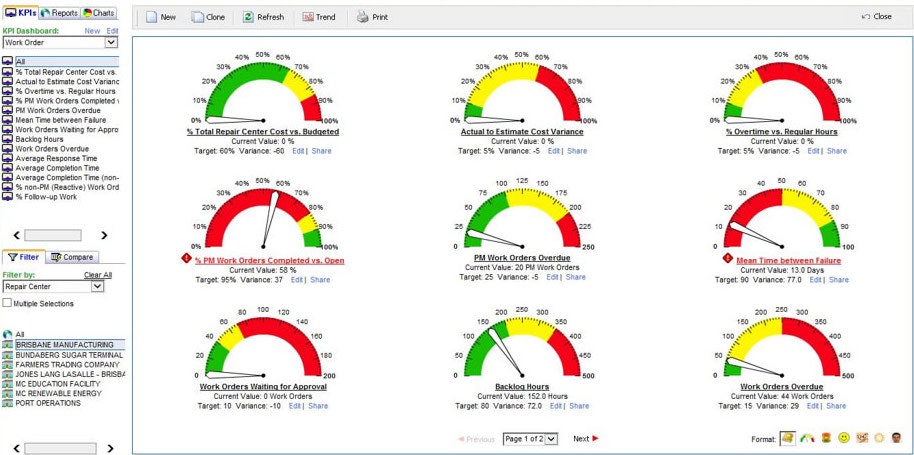
The KPI dashboard featured in Maintenance Connection
According to engineers and CMMS experts, the following three KPIs are the most important for companies in any industry to track on a dashboard:
Work Orders: Scheduled, Completed and Past Due
Maintenance managers have to know when work was completed to know whether their preventive maintenance program is working. This is best achieved when employees consistently record time started and completed in the system.
Many CMMS dashboards offer this KPI by default. Making decisions based on priority work and keeping the schedule up to date is critical, says Tim Kister, a planning and scheduling consultant with Life Cycle Engineering.
Many maintenance systems can calculate a “schedule compliance score” to convey the degree to which work orders are being successfully completed over time, in real time. The table below shows a simple example of how to determine a schedule compliance score.
Calculating a Schedule Compliance Score
Time Period | Scheduled Jobs | Completed Jobs | Compliance Score |
Week 1 | 7 | 5 | 2 jobs missed |
Week 2 | 3 | 3 | 0 jobs missed |
Week 3 | 5 | 4 | 1 job missed |
Week 4 | 6 | 3 | 3 jobs missed |
Total | 21 | 15 | 70 percent |
Using this data, we can easily calculate a compliance score by dividing the number of scheduled jobs by the number of completed jobs.
(completed jobs) / (scheduled jobs) = compliance score
(5+3+4+3) / (7+3+5+6) = 0.7 = 70 percent
Many times, work order KPIs are displayed on the dashboard as a sort of speedometer (as pictured in the previous screenshot), with the needle moving toward the right as work orders are completed.
Estimated Time Versus Actual Time Spent
Another important KPI is the actual time spent performing a job compared to the estimated time to complete the job.
A system with a mobile application even gives technicians the ability to select jobs, begin working and then simply hit a button to close out the job, all from their mobile device, then send the data to the CMMS.
Consistently underestimating the time it takes to complete a job can lead to the company paying too much in overtime labor costs—and potentially burning employees out. After some time at the company, managers should have a strong grasp of common repairs and how long they take. If overtime is regularly accumulating for certain machines or employees, this could indicate that one of the two has a problem.
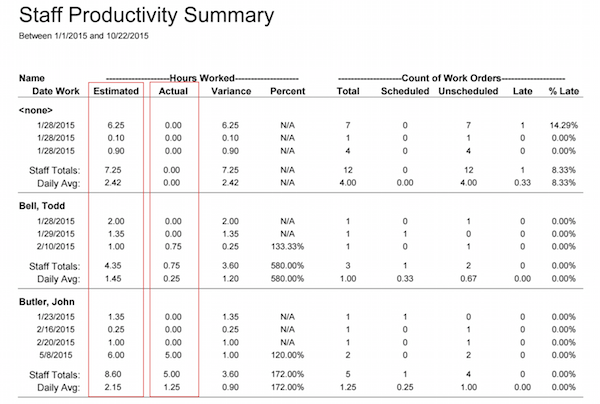
A sample productivity report generated by MicroMain, showing estimated and actual time to complete a job (noted in red)
For example, let’s say the maintenance manager at a manufacturing facility sees that the recurring preventive maintenance job to lubricate a conveyor has been completed late the last three times.
“It could indicate that they may be underestimating the time they need, if it’s always overdue—or if they have an average time, but one guy is always overdue, then maybe they have a problem with that worker,” says Craig Shepard, sales director at CMMS provider MicroMain.
Similar to the first KPI, sometimes estimated versus actual time spent is illustrated by a speedometer when displayed on a dashboard. The needle will move toward the right as work is completed either before or on schedule. If the needle is pointing toward the left, it indicates that too many jobs are past due.
Machine Downtime Versus Uptime
Each minute a critical asset is unavailable, especially in manufacturing, it costs the company money. You can access a tool in our report on modern CMMS applications to calculate just how much downtime can cost your company.
Downtime is often displayed on dashboards as a pie chart, reflecting the amount of assets in operation, those nearing a breakdown and non-operational machines. Many systems can also break this data down even further by the type of asset or the failure mode, so that management can prioritize work and improve the preventive maintenance schedule.
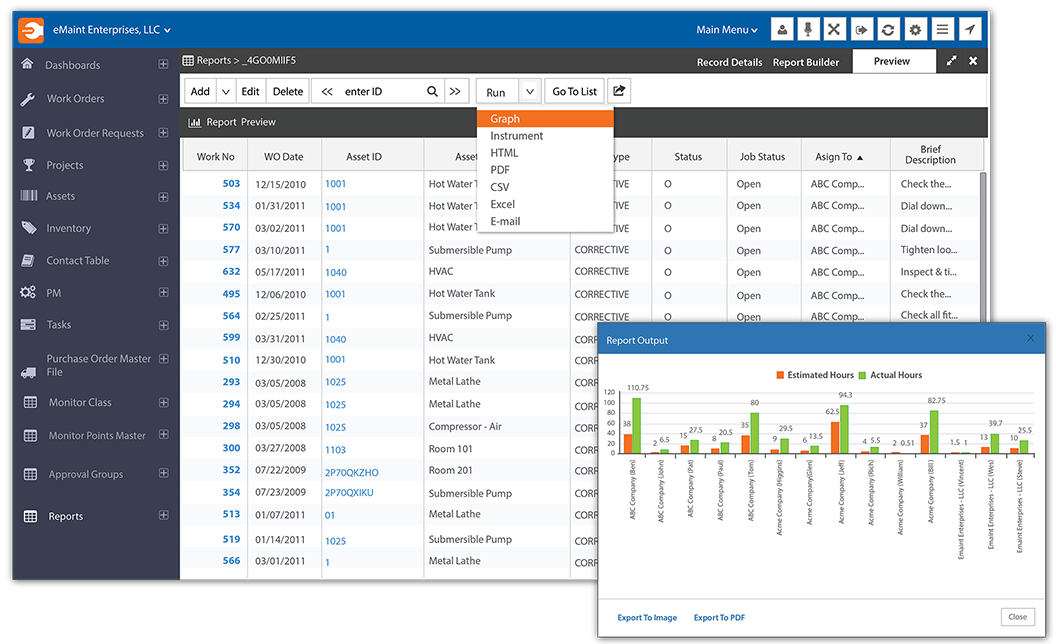
An asset downtime report from eMaint shows total downtime for each machine
Tracking these crucial KPIs gives managers a high-level overview of operations and allows them to make informed business decisions to reduce downtime, such as prioritizing jobs for assets at or nearing failure.
Not sure where to start? This video walks through the process of developing effective maintenance KPIs.
Four Steps to Facilitate KPI Accuracy
Some CMMSs allow users to customize a dashboard, but several also include the above KPIs by default. That means viewing these critical data points is often as simple as implementing software and filling it with the appropriate data.
However, there are some basic steps maintenance teams can take to make sure their data is accurate well into the future.
Determine What Results Your Company Wants
Experts suggest holding a meeting with executives and the maintenance department to determine the KPIs that will help them make those decisions. A good question to start with is: What is really driving the purchase of a maintenance management system?
“[Ask yourself,] what’s lacking?” says Shepard of MicroMain. “Typically what’s lacking is reporting ability, about 90 percent of the time.”
If the ability to create reports is a major reason for adopting software or changing systems, set guidelines for entering data and educate your team on each one.
These guidelines could include a specific format workers should use when entering the time and date of a completed job, so that the data is consistent, making it simpler to analyze in reports.
Another purchase driver could be management’s desire to reduce the time each work order takes to complete.
This requires a high-level view of the ratio between work completed on time versus work completed late. To get that type of data, managers must establish deadlines, so that there is a threshold the system can measure against to determine how often work is done in an appropriate time frame.
When consulting for Life Cycle Engineering, Kister says he often uses the metaphor of maintaining a personal vehicle to describe the importance of tracking KPIs correctly and consistently: If you don’t establish good habits, the system will be much more likely to fail down the road.
“It may be a cultural thing within the company to instill … dedication and accuracy in how they document data,” he says.
Focus on Tracking the Essentials First
Now it’s time to implement the software and the guidelines you’ve established for using it. You may think it’s best to throw every piece of data into the system at once, but that can cause problems from the start.
“My advice is to keep it simple, and start with something that you could easily track so that it doesn’t get overbearing,” Southwest Research Institute’s Hawkins says.
We recommend starting with the three KPIs mentioned above: work order status, job completion time and machine downtime versus uptime.
One way to keep data entry manageable for all software users in a maintenance department is to establish role permission settings, so that each employee only has the information and the functionality necessary for their position in the organization.
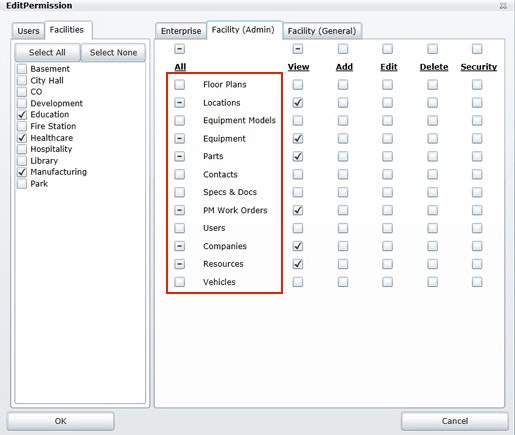
Content, such as work orders and floor plans, that administrators can build permissions around in Hippo CMMS
“You can scale each user’s permissions to what suits their roles and responsibilities,” says Daniel Golub, general manager at Hippo CMMS. “You might find that someone in admin needs access to lots of detail, while technicians have less requirements to perform their job.”
Managing permissions for each role benefits the organization by preventing users from accidentally entering information into the system they aren’t responsible for. Keeping these permissions active helps each team member focus on the task they are assigned to.
Train Employees on the Software to Increase Accuracy
You can’t expect to extract the full value of a software investment without some guidance. Software today can be incredibly powerful, and opting-in to training from the vendor helps the transition to a new system.
If workers in the field are unsure about how to use the system, the resulting report data will be spotty at best. Vendor training can keep data accurate.
“Training is very important in making sure there are plenty of details to achieve your goals,” Golub says. “Those evolve too; your objectives can change, as well, as you learn what software can do.”
Most maintenance management vendors offer training services; on-site instruction and implementation services, online courses and knowledge bases accessible through their website; and support by email or phone. These may or may not come at an additional fee.
Perform System Audits Early and Often
It’s important to ensure employees are following established guidelines for CMMS use. Perform regular audits with the following steps:
Check to see if employees are entering the right data correctly. Kister says most maintenance systems can generate reports that show user activity and behavior across a specific time period.
“From the beginning of the implementation, administrators should monitor user behavior and provide feedback to users on whether or not they are using the application as expected,” he says.
Let’s say a new maintenance technician uses a mobile app to begin a job. This particular job uses new bearings from inventory and takes 2.5 hours to complete. However, the worker forgets to note that he used spare parts and doesn’t mark the job “complete” until he arrives back at the main office 30 minutes later.
While this data can be easily corrected, these kinds of small oversights can snowball into bigger problems when reports are generated, skewing the data.
If necessary, call another meeting with the team to get employees up to speed or to answer any questions about how to enter data in the system consistently with the guidelines.
Examine data to identify any abrupt changes in trends. Generate some reports on the top KPIs and look for any major dips or spikes in the data. These changes could indicate a discrepancy in data or a real shift—both of which should prompt questions.
Kister notes that good maintenance managers should know how each KPI relates to the others. For example, if schedule compliance dips significantly during a particular month, take a look at labor utilization during that same time. The dip in compliance could be due to an unplanned, emergency breakdown that occurred when fewer workers were scheduled, he says.
Perform audits more frequently in the first couple of years. During the first year after implementation, check user behavior monthly, Golub says. Start scaling that back to bi-monthly after six months, then quarterly after one year.
This way, management can either see a steady progression of good data-entering habits over time, or address those users who aren’t practicing them.
Additionally, administrators should gather user feedback and make any necessary changes, he says. Managers could reach out to the vendor for additional on-site training or to help add customizable drop-down fields for certain KPIs.
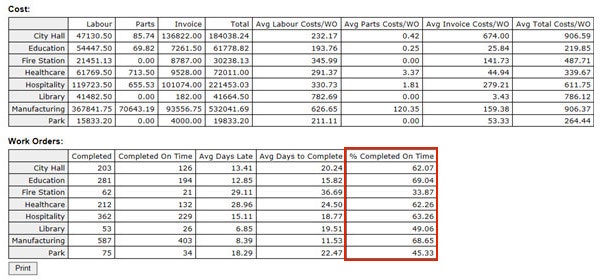
A sample summary report from Hippo CMMS used for audits
The portion of a summary report above, generated in Hippo CMMS, breaks down data for costs and work orders. Managers can use reports like these during audits to see which facilities have the lowest on-time work order completion rates (noted in red), which would prompt them to further inspect the habits of those particular workers to determine where the problem lies.
How Can I Build My Own Maintenance Dashboard?
Most maintenance systems offer some kind of customizable dashboard, so you should look for a vendor who offers training and strong support to ensure you know how to get the most out of your KPIs.
A great way to do that is by calling our software advisors at (844) 687-6771 for a free consultation to help you narrow down your choices based on your specific needs.
If you prefer to browse yourself, check out our Maintenance Management Software page to see screenshots and reviews of the top systems.