7 Top Rated Business Intelligence Software
As a data analyst, you’d know the struggle behind collecting data from multiple sources. Sorting this data and inferring actionable insights from it is no cakewalk either. If you relate to these challenges, you can benefit from a business intelligence tool.
Business intelligence software pulls data from various sources and supports automation so that you don’t have to spend hours manually collecting data and generating reports. Finding the right BI tool for your small business will also make data prepping quicker and enable you to make crucial business decisions confidently.
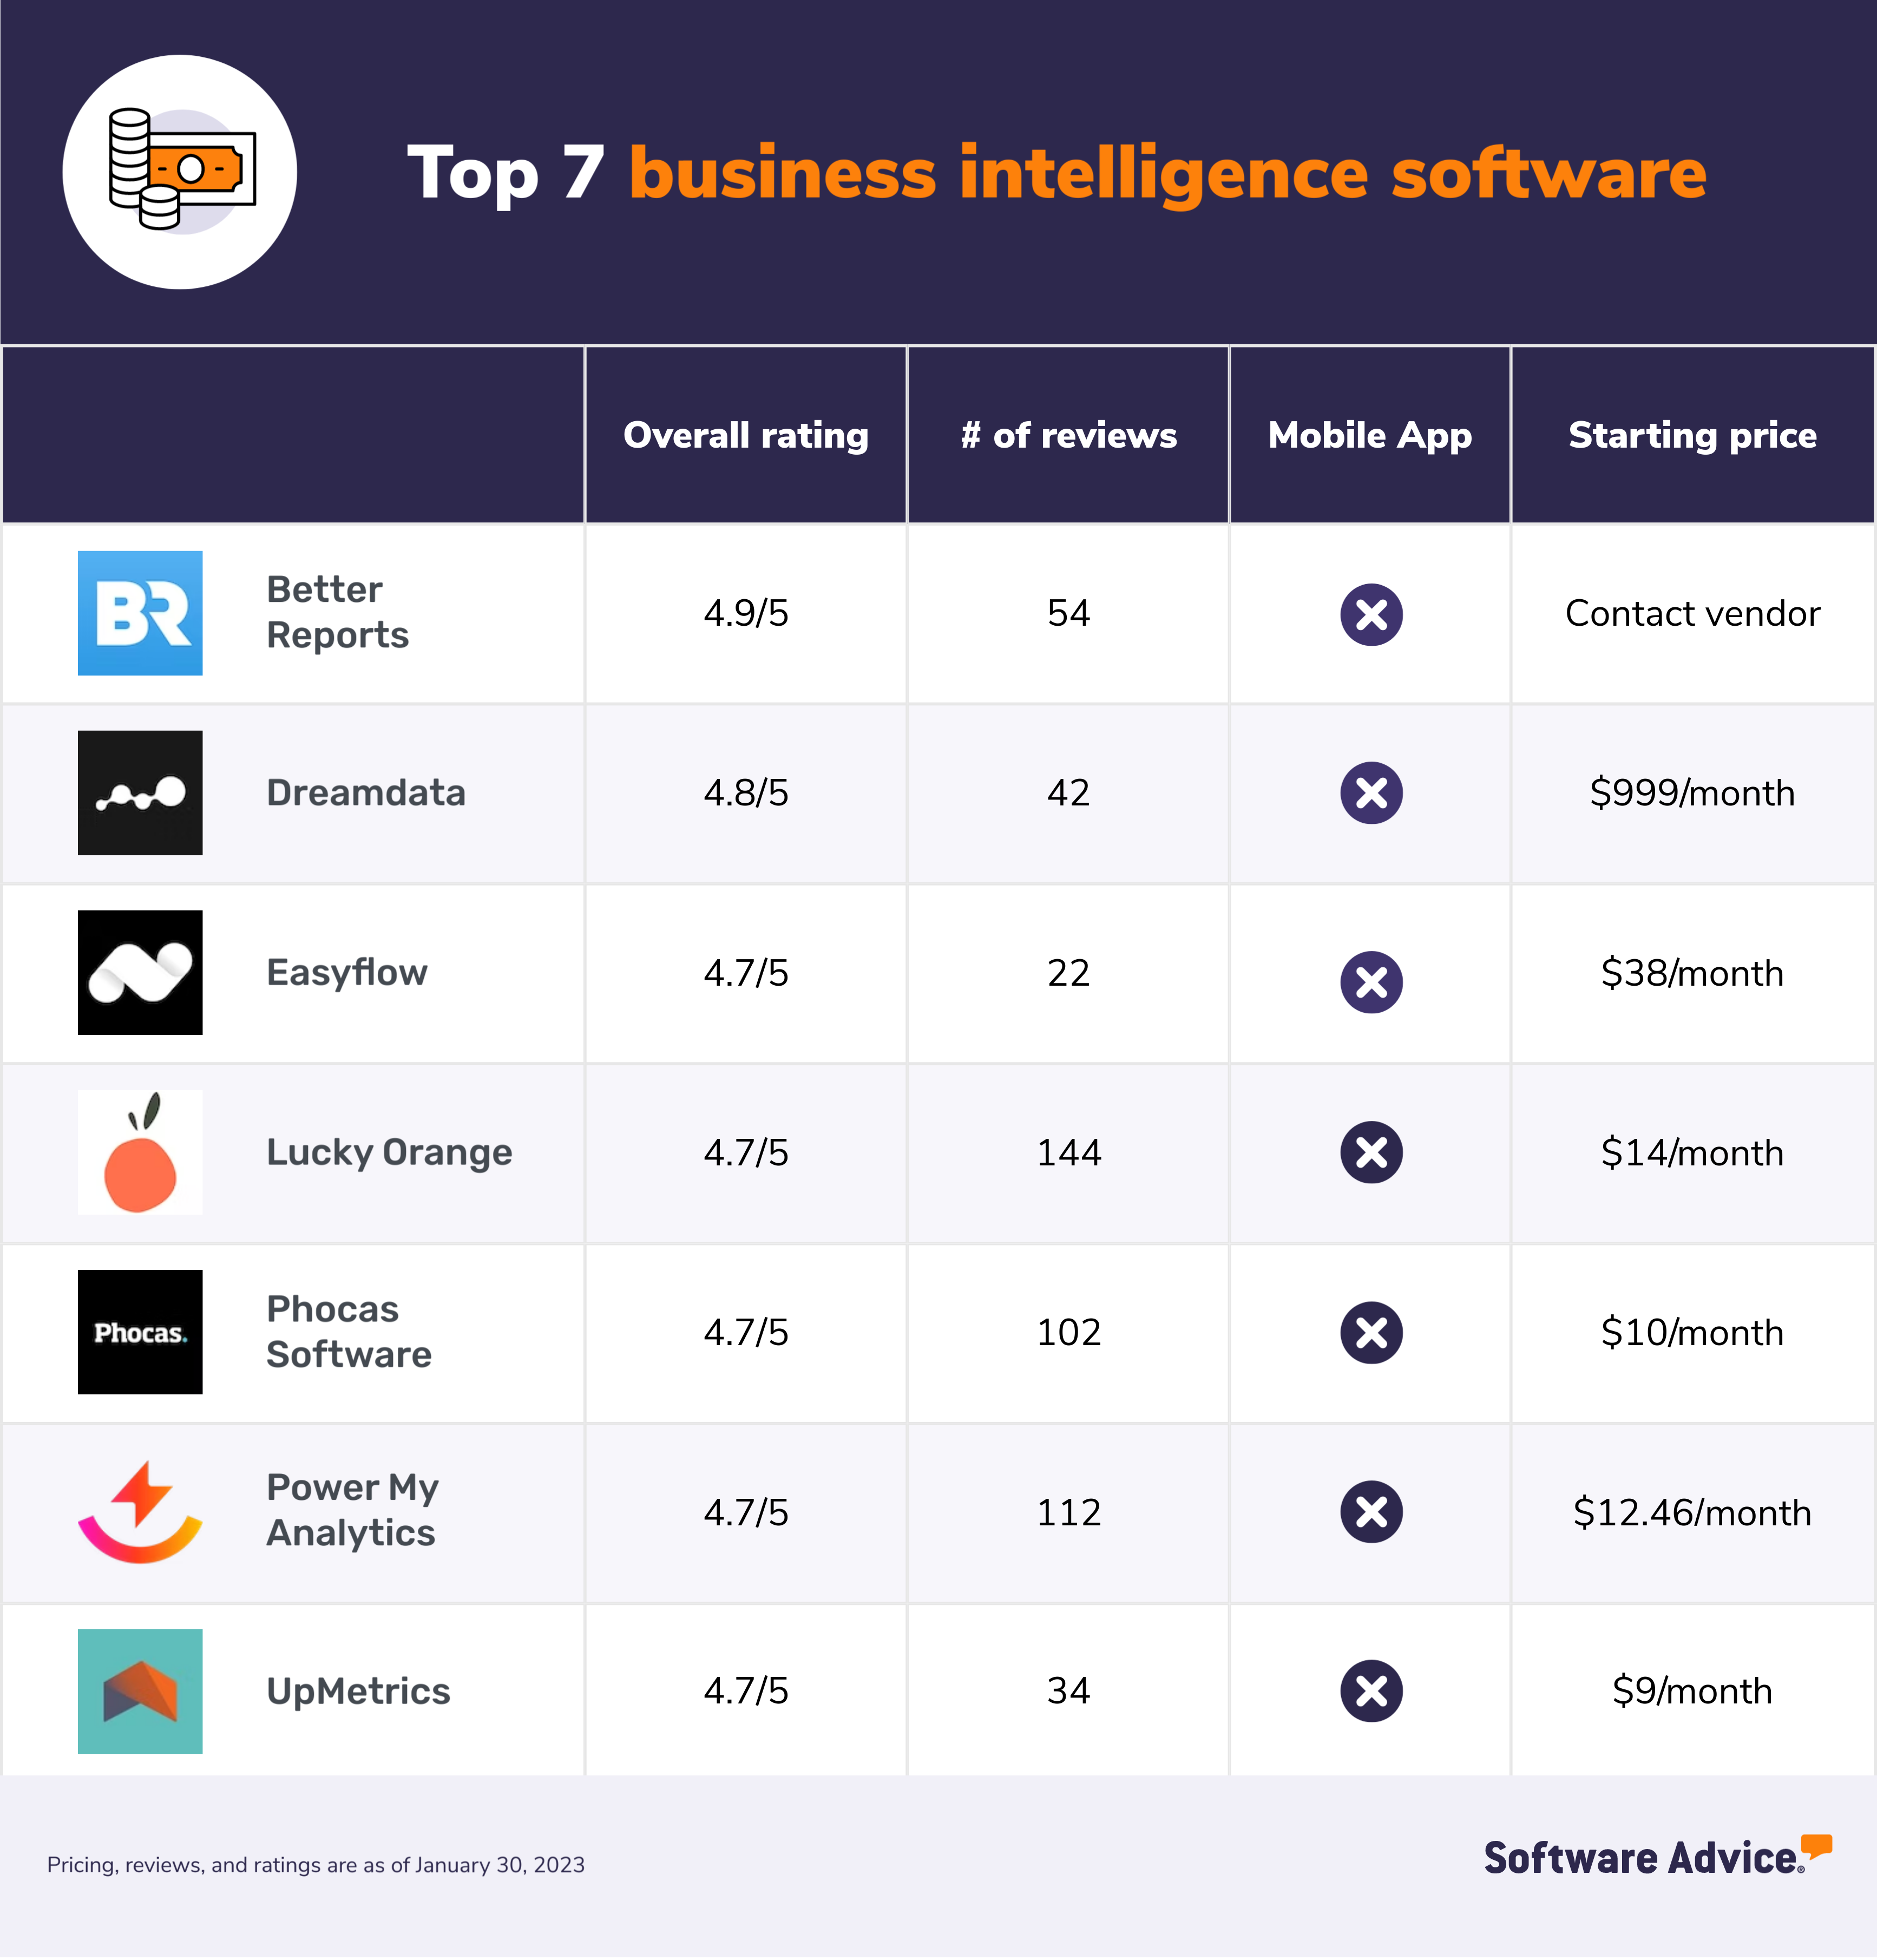
We highlight the seven top-rated business intelligence software products for business data analytics, in alphabetical order, based on verified software reviews. Read more.
Check out the complete list of business intelligence tools in Software Advice's software directory.
1. Better Reports: Automatically generates and delivers reports to mail inbox
Better Reports is a data analysis tool that helps analyze data from multiple data sources. You simply have to connect your apps to this tool, which automatically imports the data for analysis. Some examples of the apps that you can connect to this tool are QuickBooks, Google Sheets, Stripe, PayPal, and Salesforce. The solution is also capable of automatically generating reports and sharing them with you. Create daily, weekly, or monthly reporting schedules, and the business analytics tool will create reports and deliver them to your mail inbox.
Product features of interest*:
Visual report builder: Use pivot tables or visual charts such as bar graphs and pie charts to convert your metrics into visuals.
Built-in reports: Choose from 100+ report templates to present your metrics or customize those reports for personalization.
Report export: Download your reports in CSV, PDF, Excel, or HTML file formats.
Customer support options: FAQs, help articles, and email
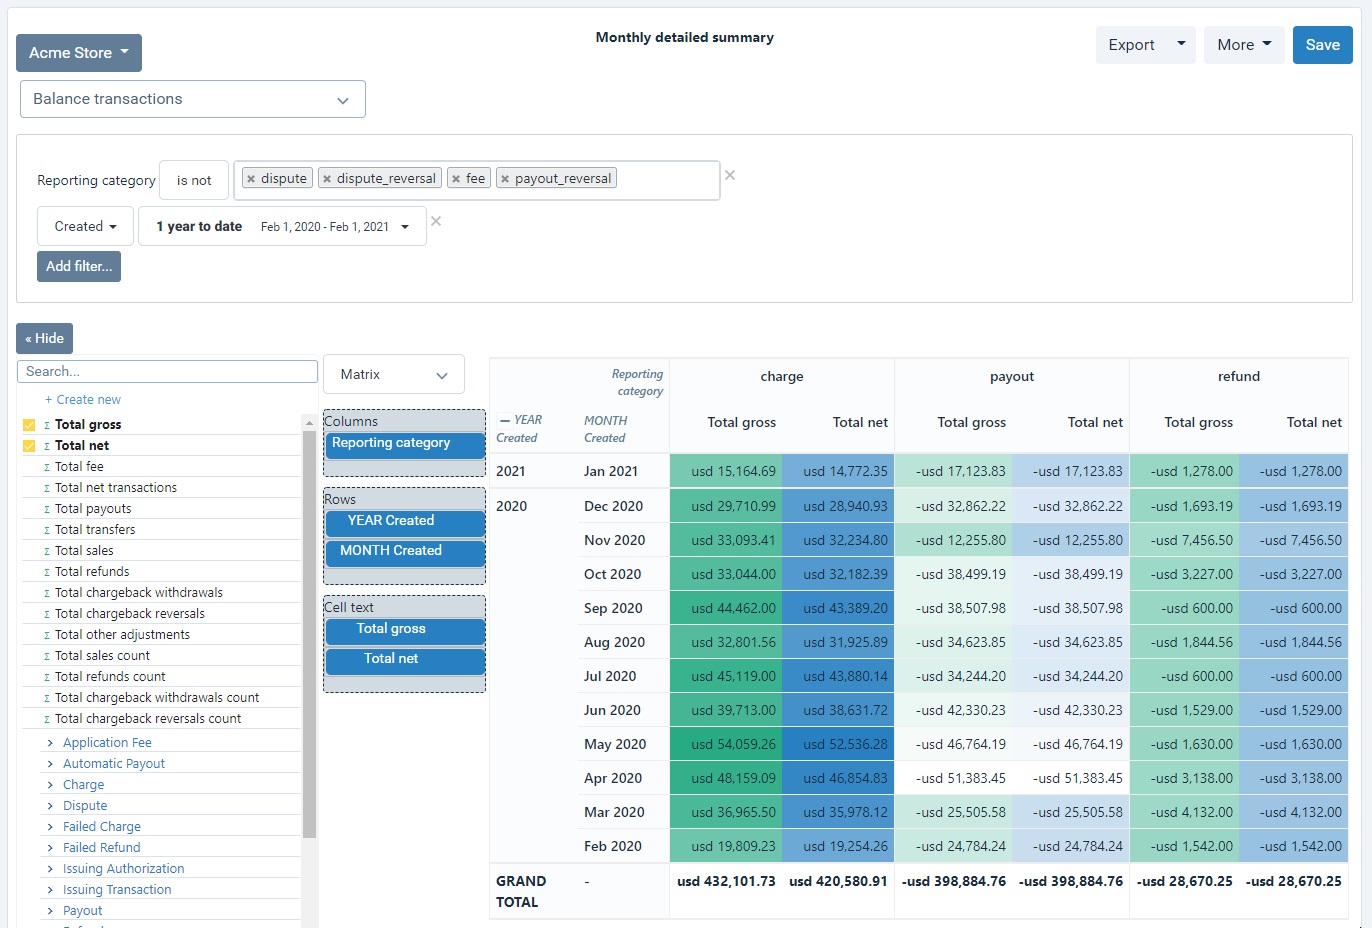
Pivot table in Better Reports (Source)
2. Dreamdata: Supports account-based web analytics
Dreamdata is a B2B revenue attribution and business intelligence platform that helps extract data from multiple sources such as site user behavior, CRM, and help desk and clean and refine it for analysis. The tool can also visualize the data so that you can identify important metrics and relationships within the data and gather actionable insights. Moreover, the tool supports account-based web analytics using which you can understand your URL performance by tracking and analyzing the behavior of specific, identified accounts or organizations.
Product features of interest*:
Influenced deals analytics: Track and measure the impact of influencer marketing efforts such as sponsored content, social media posts, and influencer-led events on target accounts.
Conversion tracking: Analyze the actions of visitors on your website that led them to take desired actions such as downloading media, signing up, or making a purchase.
Customer journey mapping: Visualize the journey of a customer (from initial awareness to post-purchase experience) in the form of flowcharts or diagrams to identify how a customer interacts with your business.
Customer support options: Product videos, FAQs, help documents, phone, and email
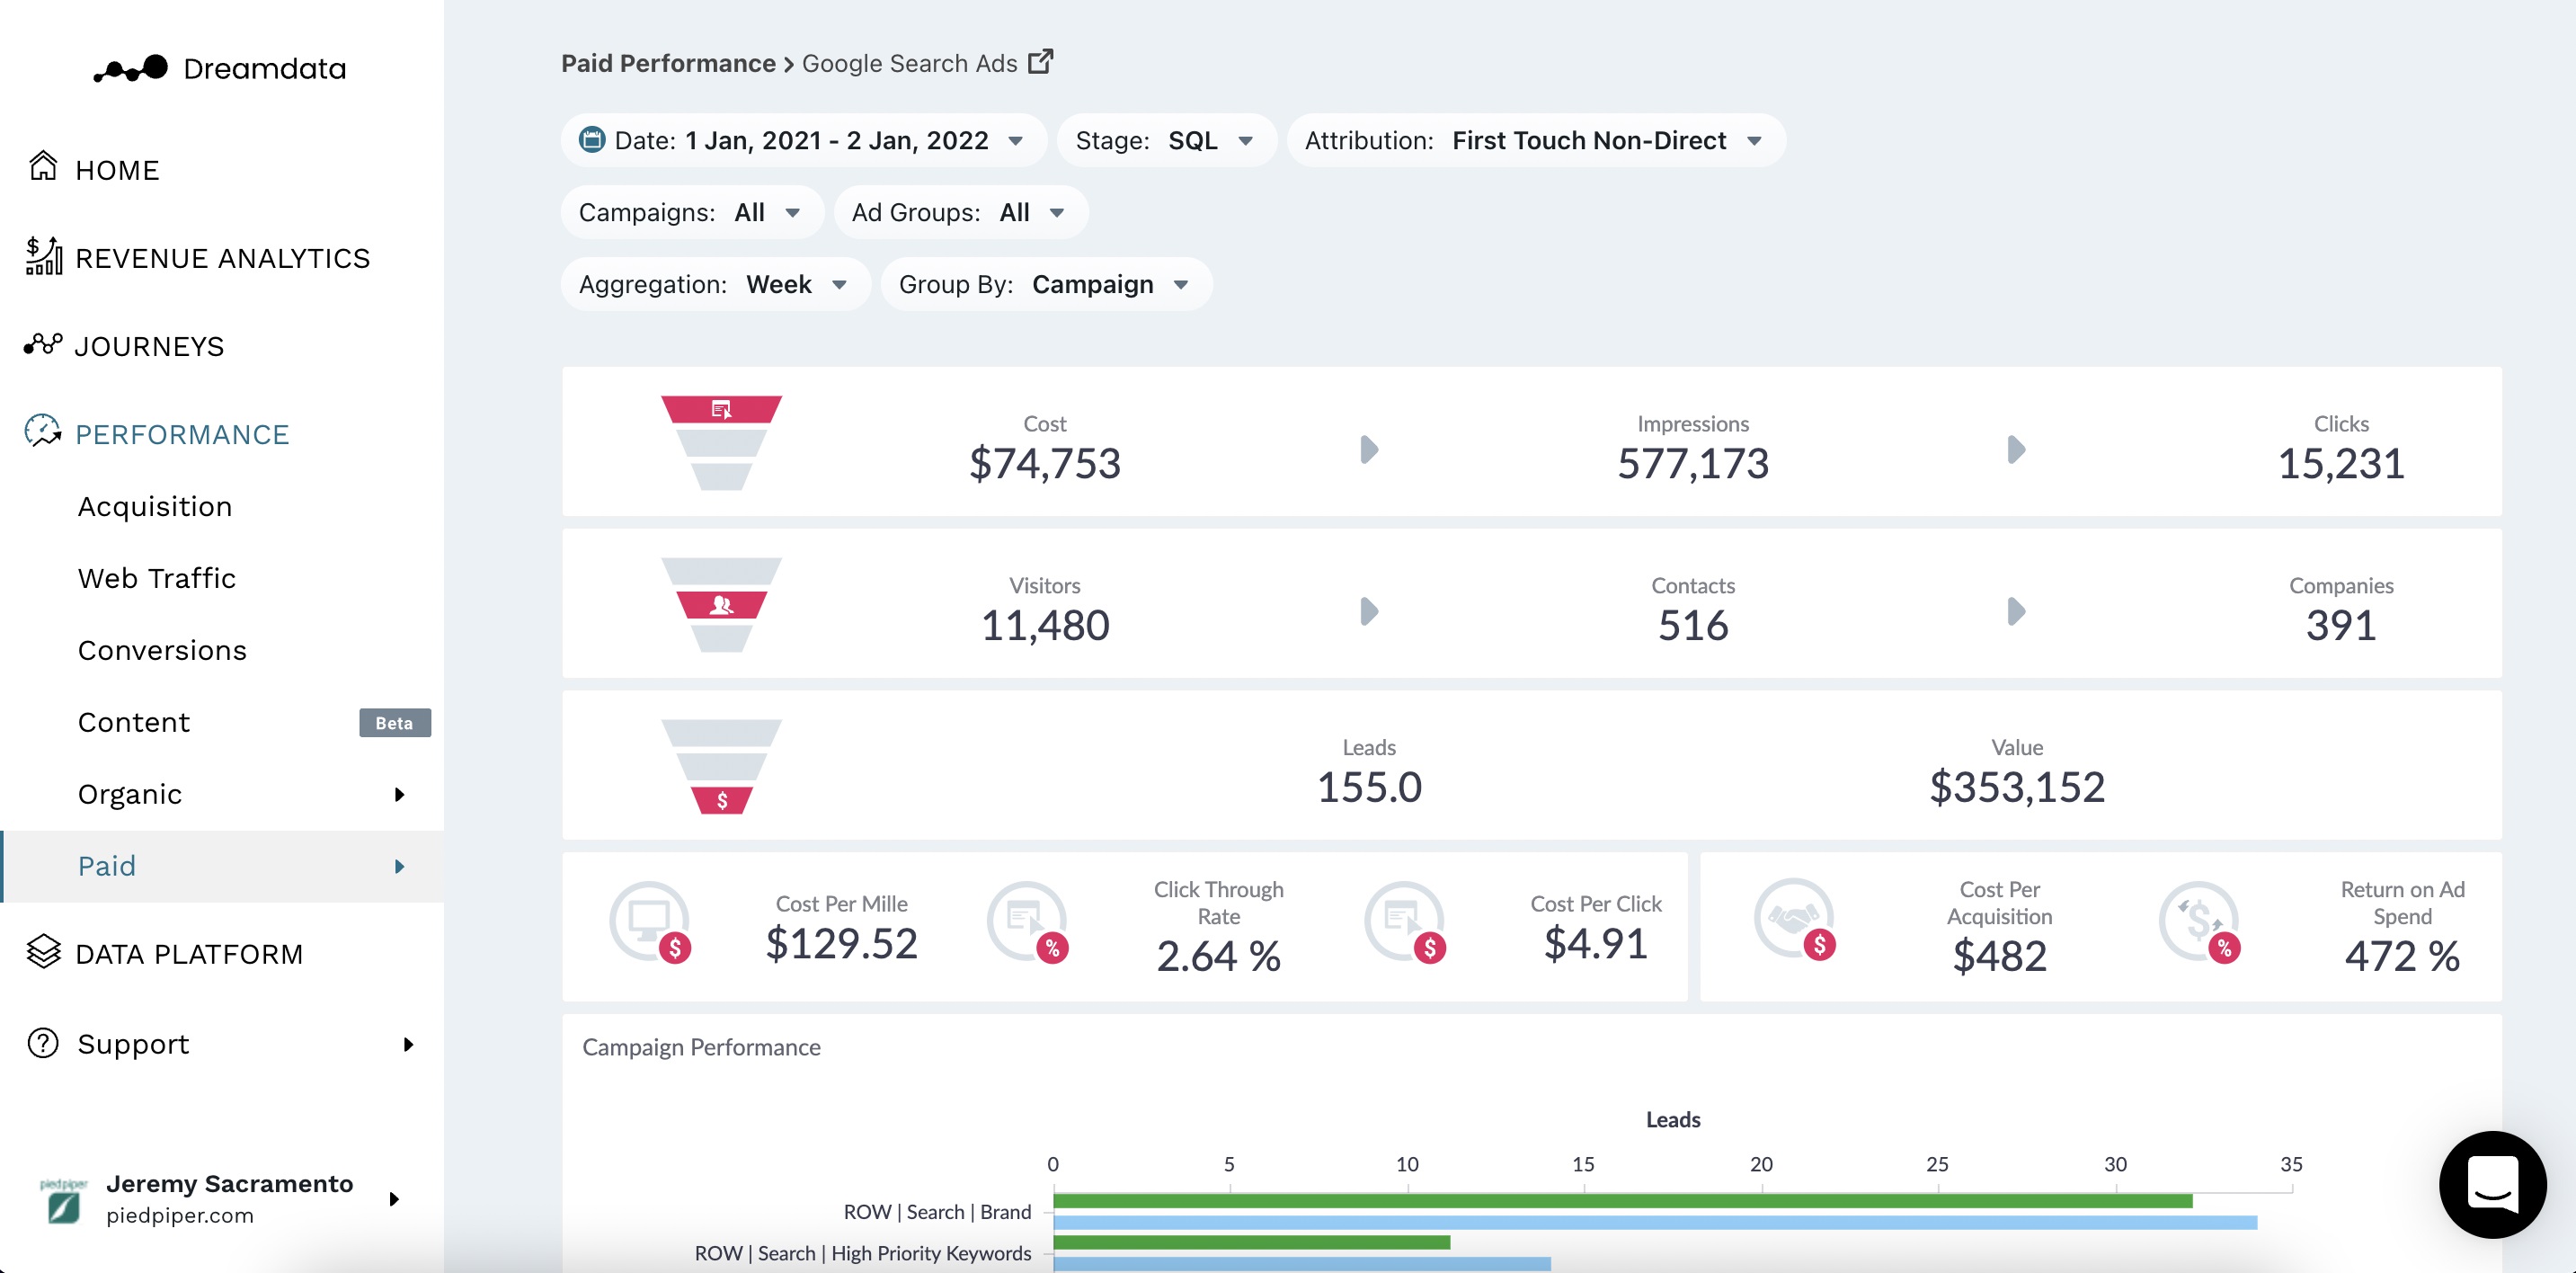
Customer journey map in Dreamdata (Source)
3. Easyflow: Encrypts data in transit for security
Easyflow is an automation and business intelligence platform. This tool allows you to build your automation workflows and connect multiple applications using drag-and-drop functionality. Easyflow supports over 100 data sources that you can integrate with to source data for analysis. You can also visualize the data on a custom dashboard to keep track of real-time updates. To protect your data against leaks and theft, this BI tool offers end-to-end encryption for data in transit.
Product features of interest*:
Filters: Set conditions for data to be retrieved and refined.
Query builder: Calculate new metrics to measure product improvement impact, spikes in traffic, and more from multiple data sets without changing the values of existing data.
Email snapshots: Automatically get screenshots of the updated dashboard delivered to your email on a schedule created by you.
Customer support options: Video tutorials, FAQs, help articles, chat, and email
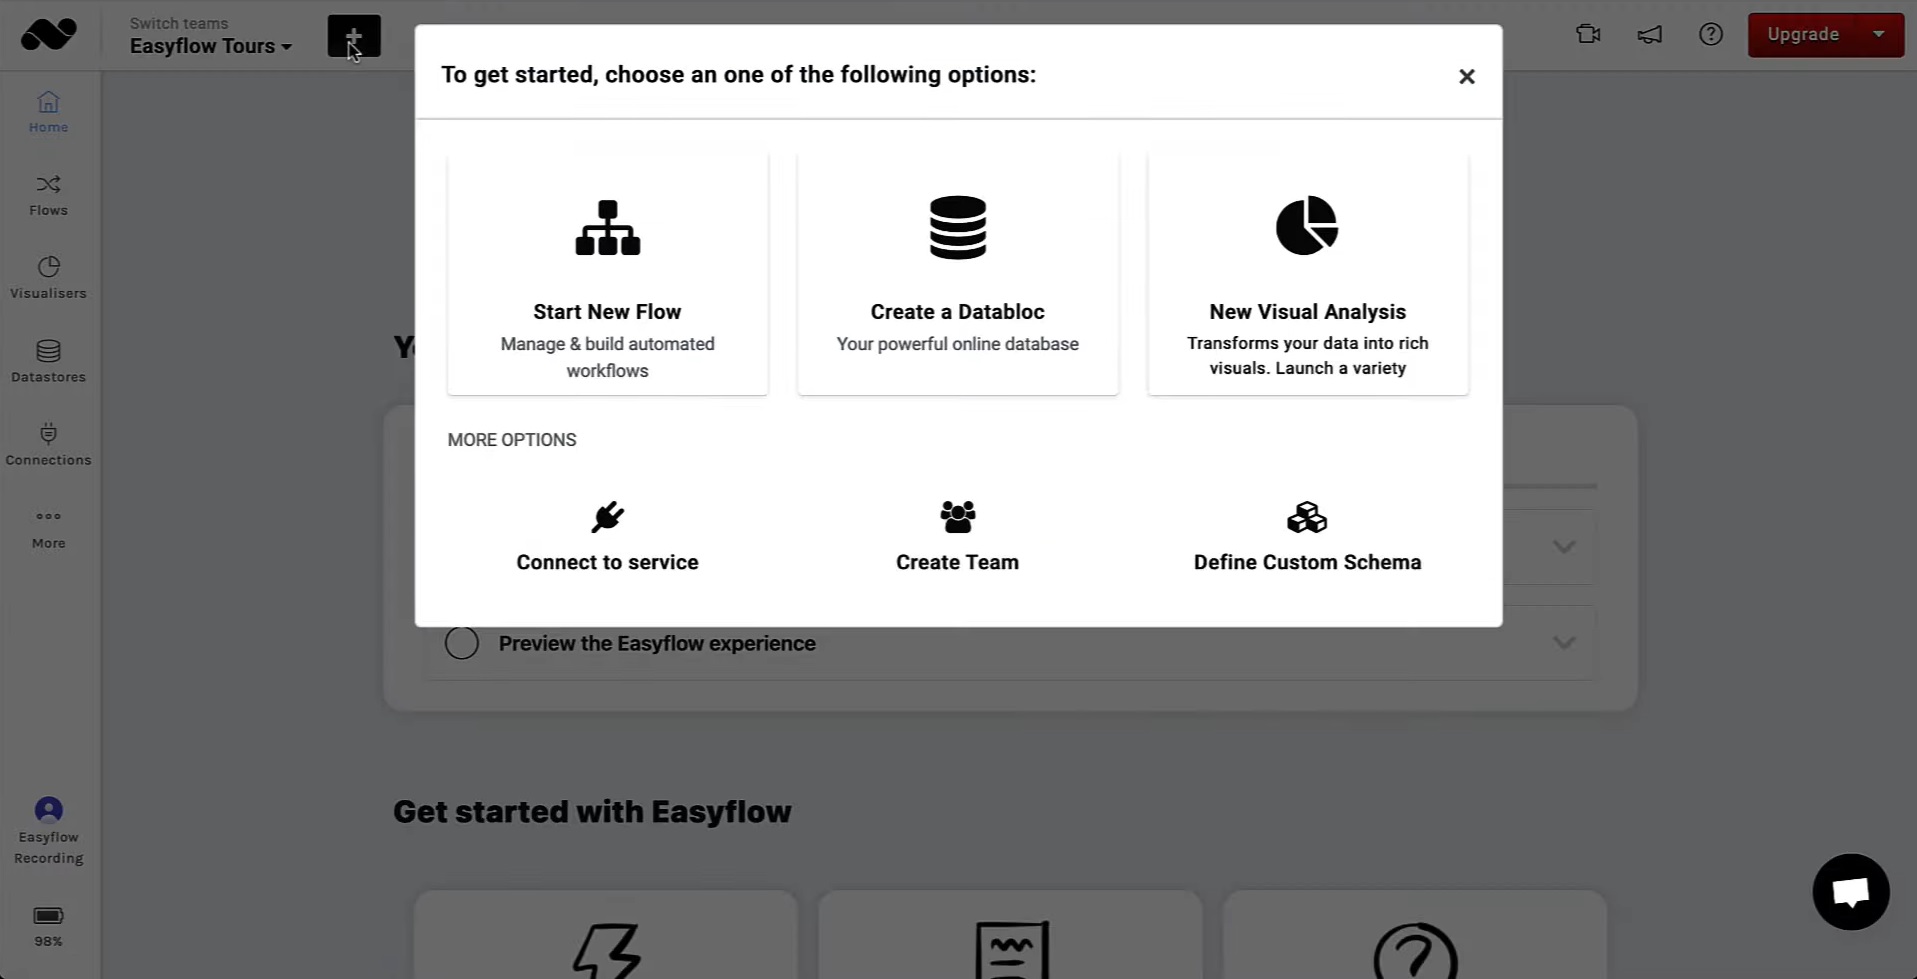
Automation workflow creation in Easyflow (Source)
4. Lucky Orange: Records visitor sessions
Lucky Orange is a business intelligence tool that processes data to help you improve your website’s conversion rate. This software records visitors’ sessions and allows you to replay them. You can use these recordings to understand where on the page visitors are clicking. You can integrate this BI software with tools such as Google Analytics, HubSpot, and Shopify.
Product features of interest*:
Heat maps: Analyze which parts of the webpage are driving conversion and how visitors are interacting with page elements such as forms, pop-ups, and menus.
Form analytics: Understand why visitors are abandoning your forms by measuring the performance of each form field and identifying the field visitors are working on before abandoning.
Visitor profile: Create a profile of each website visitor to record their demographics, browsing habits, and time spent on the site.
Customer support options: FAQs, help articles, feature guides, and chat
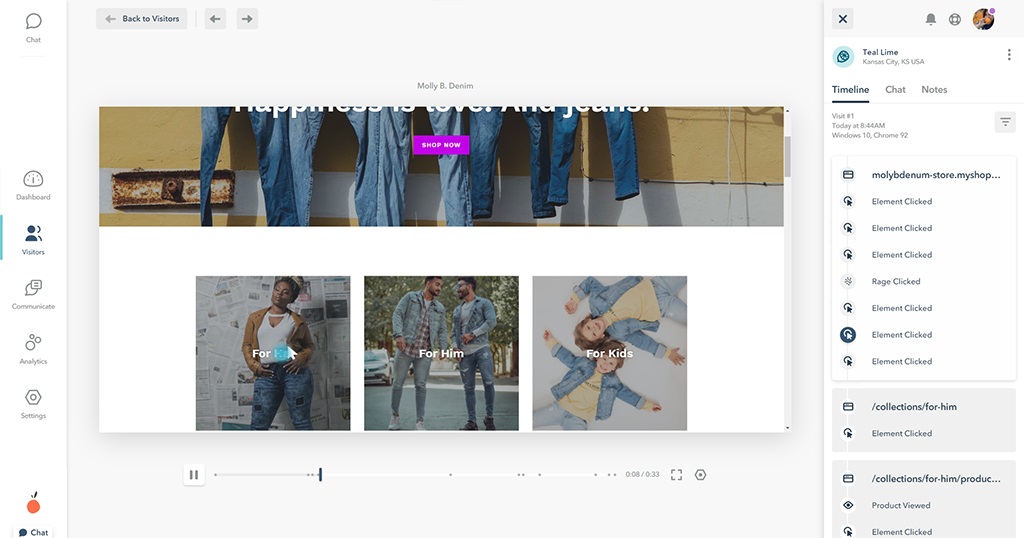
Session recording in Lucky Orange (Source)
5. Phocas Software: Provides various ways to enable collaboration within teams
Phocas Software is a business intelligence and data analysis tool. It allows you to consolidate business data from enterprise resource planning (ERP), customer relationship management (CRM), and accounts payable/accounts receivable (AP/AR) systems to conduct historical and predictive analytics. Using this business analytics tool, you can collaborate with your teammates by sharing your dashboards and reports via email. You can also mention team members and invite them to collaborate or change permissions to ensure the right people have access to the right data.
Product features of interest*:
Data visualization: Visualize your data on a dashboard using charts and graphs to track performance at a glance.
Collaboration: Create custom dashboards and reports and allow multiple users to access them or deliver the same to their emails directly.
Automated reporting: Set conditions for the tool to automatically generate customizable reports and deliver them to your mailbox on a predefined frequency.
Customer support options: Case studies, eBooks, webinars, discussion forums, video tutorials, and email
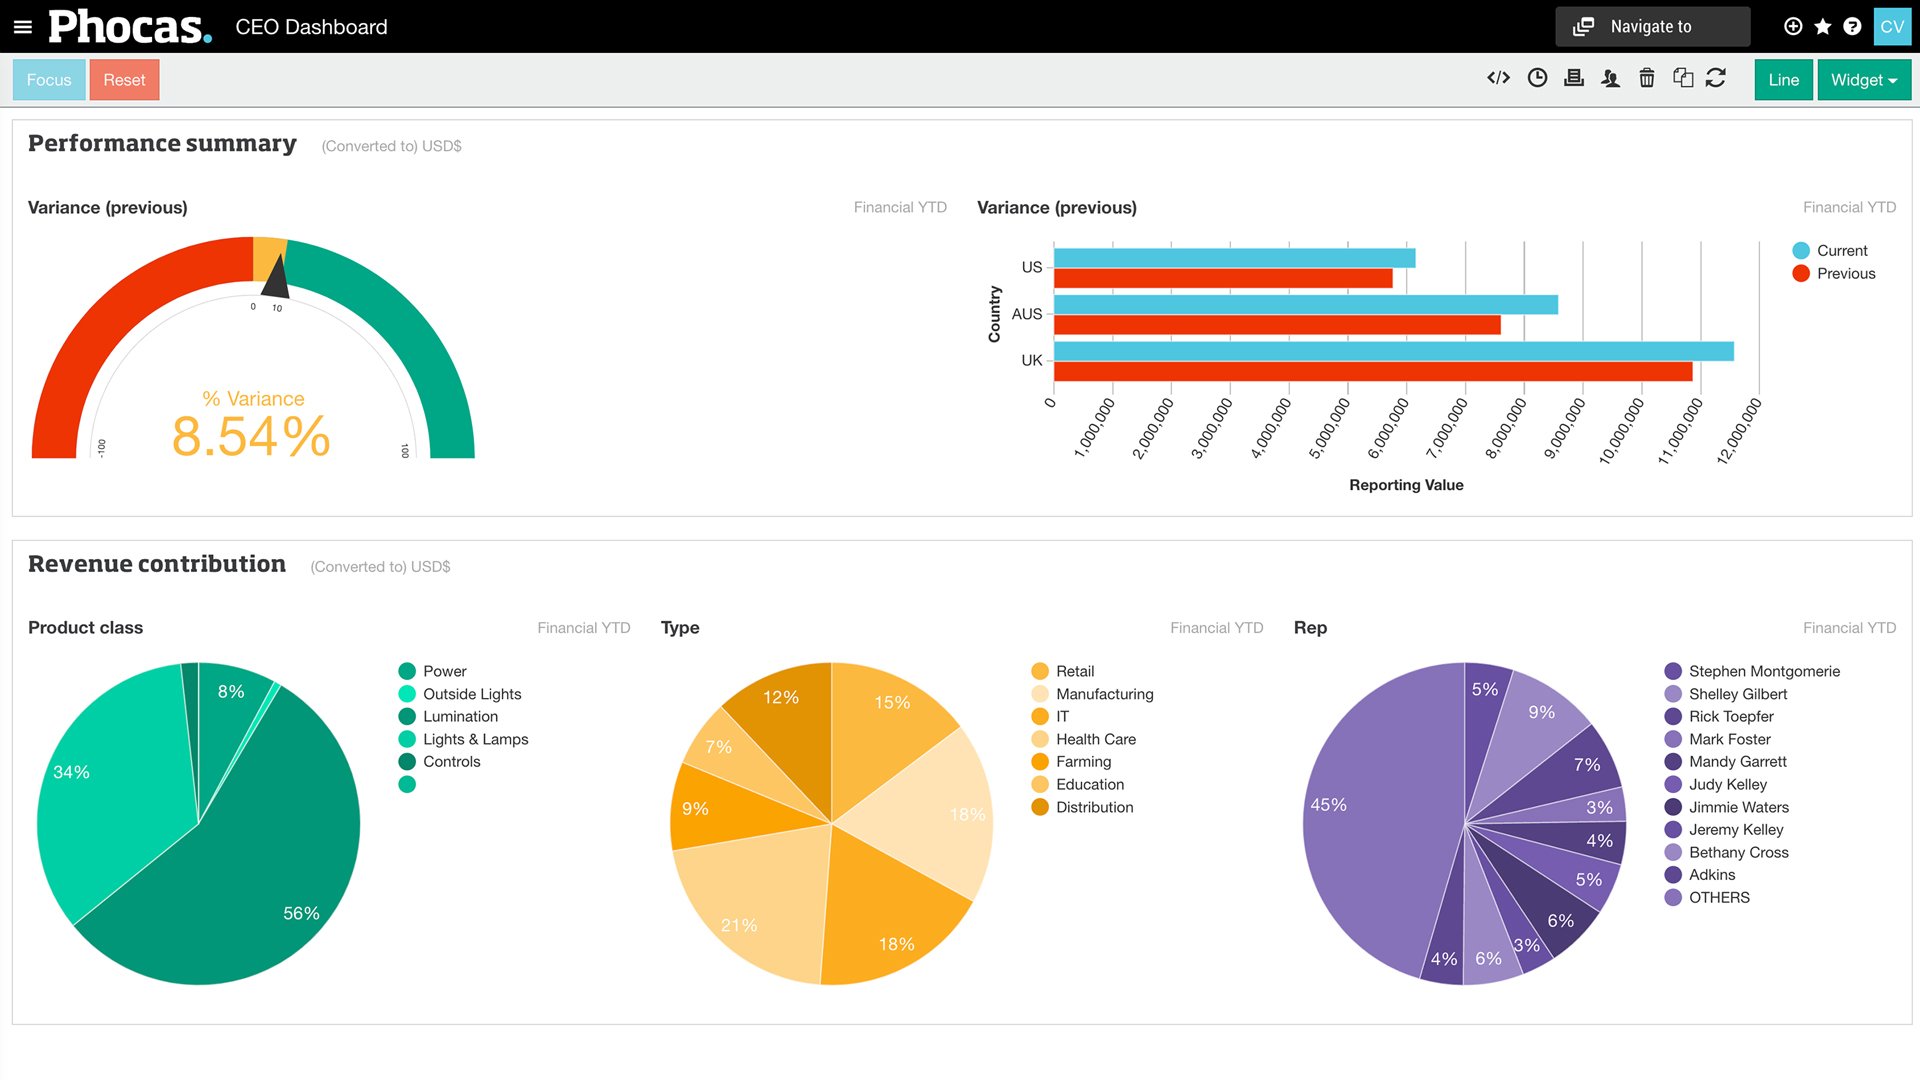
Performance dashboard in Phocas Software (Source)
6. Power My Analytics: Comes with multiple templates for reports
Power My Analytics is a data analytics and business intelligence platform that helps you automate your marketing data with artificial intelligence. The tool helps you collect data from over 40 marketing platforms. These platforms include Facebook, Twitter, LinkedIn, Pinterest, and HubSpot. Besides, this BI tool supports various types of reporting and offers multiple templates for the same. Some of the included report templates are PPC advertising, Facebook Page Insights, and Shopify metrics.
Product features of interest*:
Data integration: Integrate data for analysis from sources such as SQL, Google Data Studio, and Google Sheets.
Data connectors: Source data from sales platforms such as Amazon Seller Central, Constant Contact, Facebook Ads, Instagram Ads, and more.
Dashboard templates: Choose from multiple dashboard templates and customize them to create a personalized dashboard to track relevant metrics and infer actionable insight.
Customer support options: Help articles, FAQs, phone, and email
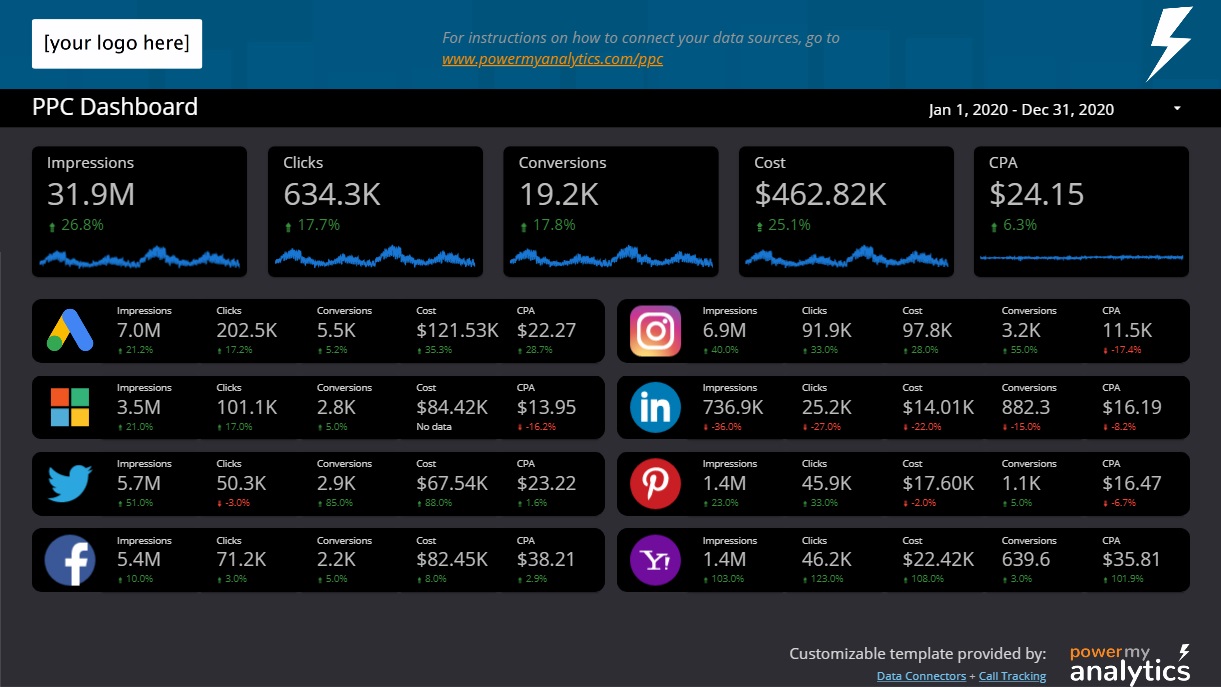
Pay-per-click (PPC) dashboard template in Power My Analytics (Source)
7. UpMetrics: Supports surveys for real-time data collection
UpMetrics is a data analysis and management platform that allows you to consolidate data from sources such as public data, grantee reports, and survey data. With this BI software, you can analyze data in real time and use visual analytics to make it understandable. This tool allows you to deploy mobile-friendly surveys to collect data and update data dashboards in real time.
Product features of interest*:
Financial forecasting: Generate revenue and product forecasts based on historical data.
Team collaboration: Collaborate with team members in real time by tagging them in comments.
Business plan builder: Build a business plan by offering design elements such as templates for cover pages.
Customer support options: Video guides, eBooks, email, and chat
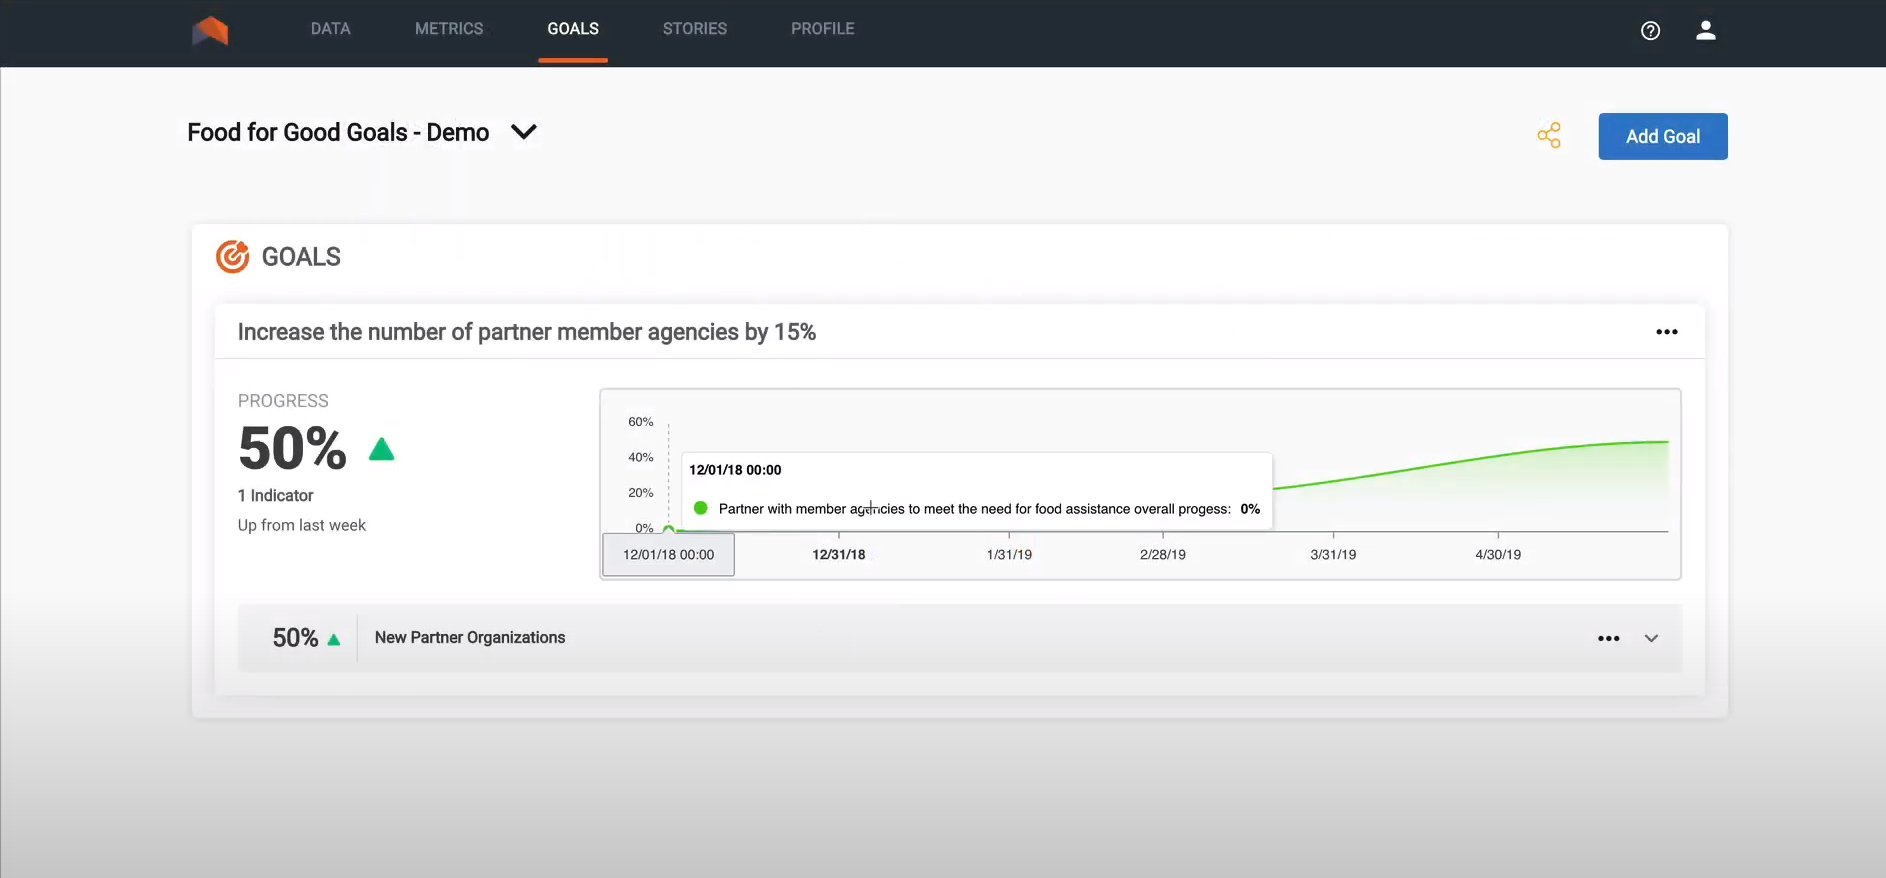
Goal tracking in UpMetrics (Source)
How to choose the best business intelligence software for your business
Check if the software has no-code capabilities: Preparing data for analysis is one of the most important tasks to get accurate results. Preparation involves filtering raw data, structuring it, or categorizing it into various groups. A BI tool with no-code capabilities makes this step much easier, as little-to-no technical knowledge is needed. Therefore, if you or your teammates come from a non-technical background, go for a BI tool with no-code capabilities.
Look for tools that support the most data integration options: You can have multiple data sources and warehouses. Social media platforms, CRM tools, and ERP solutions are examples of where data can lie. Thoroughly analyze where all your data is spread and look for BI tools that can pull and analyze your big data from all your sources.
Select software with maximum visualization tools: Visualization tools make complicated data insight easier to read and understand. Some examples of visualization options are column charts, bar graphs, line graphs, pie charts, and stacked bar graphs. Go for a tool that provides maximum data visualization tools, as this will allow you to find which way works best for you.
How much does business intelligence software cost?
Most products in the market are priced on a "per month" basis and can be broken down into three common pricing tiers based on their starting price.
Price ranges:
$12 - $16
$17 - $27
$28+
*The pricing included is for the entry-level/lowest-priced offering found on vendor websites on January 30, 2023. These ranges correspond to the 25th, 75th, and 100th percentiles of pricing information gathered from vendor websites of sample products.
Hidden costs associated with business intelligence software
The above pricing list summarizes pricing for the base plans of most products. An enterprise or premium product that is priced higher may include additional features, for example, benchmarking, profitability analysis, data mining, strategic planning, and metadata management. However, even if you decide to go for the free plan of a BI tool, there may be some hidden charges, such as training and implementation costs, customization costs, and integration costs. You may also have to incur some costs to increase the source of your data. So, before you make any choice, ask the software vendor about such hidden charges of their business intelligence tools to ensure full pricing transparency.
Frequently asked questions when selecting business intelligence software
Does the software allow automation?
Some business intelligence tools allow you to schedule automatic report generation on a daily, weekly, or monthly basis. Other tools automatically import data from linked sources for analysis or send analysis reports via automated emails. Ask your vendor if their BI platform supports automation so that you can save manual efforts on such tasks.
Does the software support collaboration?
Collaboration features allow you to give and take feedback from colleagues and use each other’s expertise for various projects. Features that allow you to share your reports with your team or add people to projects by mentioning them make collaboration easier. Check with your vendor whether such features are part of their BI solution if you often work on collaborative projects.
What type of technical support does the software offer?
Examine the available technical support options of the business intelligence platform you are considering. Ask the vendor if they provide support options such as guides, user manuals, training, or paid support. Also, check if phone, email, or live chat support options are available.
Methodology
To be included in this list, products must:
Have at least 20 unique product reviews published on Software Advice within the past two years, with an average rating of 3.0 or higher, as of January 30, 2023. We selected the top seven products from Software Advice’s FrontRunners report for business intelligence software, having the highest ratings to feature in this article.
Include a dashboard, self-service data preparation, and visual analytics as core features.
Meet our business intelligence software market definition: “Business intelligence (BI) software helps organizations make operational decisions by enabling the analysis of historical performance data and other data sources.”
*Product features have been highlighted based on the features available on the vendor website as of January 30, 2023.
We select and rank products based on an objective methodology developed by our research team. While some vendors may pay us when they receive web traffic or leads, this has no influence on our methodology.
Products evaluated for the pricing calculation were taken from Software Advice’s business intelligence software directory. The pricing ranges exclude freemium versions of the products. The features highlighted were identified based on their relevance and the percentage of products in the Software Advice directory that offer them.