What Is a PERT Chart? Learn How This Tool Can Keep Your Projects On Track
Pop quiz!
What is a PERT chart?
A visual representation of a project’s timeline using rectangles and circles as nodes to represent milestones.
A project management planning tool.
An evaluation technique developed by the U.S. Navy for use in the Polaris submarine missile program.
All of the above.
If you guessed “4,” you’re absolutely correct! But now you might be asking: “What do the Navy and project management have in common? And did you say missiles?”
We did say missiles. As it turns out, this naval technique from 1957 is called a PERT chart and is more applicable to present-day project management than you might think.
To learn how to use a PERT chart for project planning, we interviewed Dr. Dan Patterson, CEO and founder of risk advisory group PMFocus, and Kevin Archbold, consulting manager for project management consulting firm Key Consulting.
Here’s what we’ll cover:
How are PERT charts used in project management?
What does a PERT chart have to do with the critical path method?
What are some best practices for creating PERT charts?
How is PERT chart software beneficial to project managers?
What is a PERT chart?
A PERT chart is a schematic of the project schedule.
A project/program evaluation review technique, or PERT chart, is a graphical representation of a project’s key milestones and timeline. The PERT chart accounts for inevitable changes that occur in a project’s schedule that impact the project finish.
The technique was initially developed by the Navy in the 1950s for the Polaris submarine project. Today, PERT charts are used by teams across industries looking to plan and execute a complex project more effectively.
Simply stated, a PERT chart is a diagram of a project schedule.
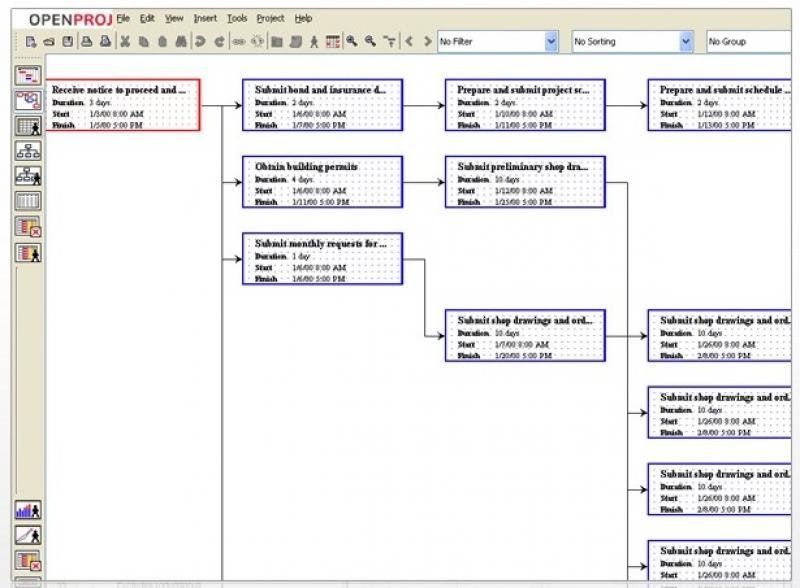
The schedule is shown as a network diagram most commonly illustrated with “nodes,” representing important tasks or milestones, and “vectors,” or directional lines, illustrating the sequence of the tasks.

Example of a PERT chart in OpenProj (Source)
A network diagram, or PERT diagram, shows the sequence of tasks and milestones, but it also illustrates how those tasks and milestones are prioritized—i.e., their precedence. This is why PERT charts are often referred to as “network diagrams” or “precedence diagrams.”
A true PERT chart involves a 3-point estimation technique, which assigns three possible duration estimates to each task:
Optimistic
Pessimistic
Most likely
This estimation technique allows project managers to calculate a more realistic project schedule. And makes it easier to calculate “what-if” scenarios.
“PERT charts are an excellent training tool for a project. It helps a person truly understand the underpinnings of a schedule,” says PMFocus’s Patterson.
How are PERT charts used in project management?
PERT charts are used in project management as a data visualization tool.
PERT charts help project teams visualize the order of tasks, milestones, and phases within a project. Illustrating the project schedule makes it easy to identify tasks as one of two types:
Dependent, or sequential tasks
Non-dependent, or concurrent tasks
This allows project managers to coordinate work across teams and departments more effectively. “[PERT charts] do an excellent job of showing when work is to be executed and how that work relates to other areas of scope in the project,” says Dr. Patterson.
Dr. Patterson also states that “with the ability to color code nodes in a PERT chart to represent additional metadata such as cost or resources, your PERT chart then becomes even more powerful.”
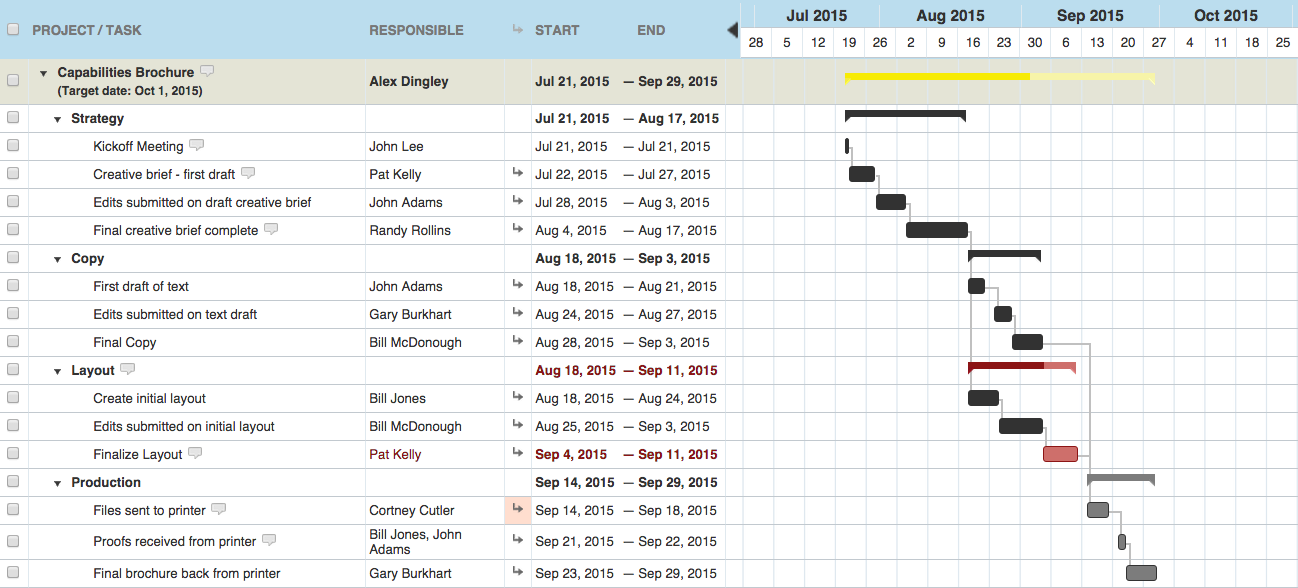
PERT charts are often used in conjunction with another popular data visualization tool: Gantt charts. Gantt charts also depict the project schedule, but instead of a network diagram, Gantt charts show the schedule as a horizontal bar chart across a calendar.

Gantt Chart in WorkZone (Source)
Key Consulting’s Archbold states that: “A Gantt chart should be developed from the network diagram… A Gantt chart derived from a network diagram is much easier to maintain and is more accurate.”
Archbold explains that network diagrams are the core of the project schedule. While Gantt charts are useful for ensuring teams stick to a schedule, PERT charts should be used to calculate a realistic timetable before the project even begins.
Once a project is underway, project managers use the PERT chart to monitor the accuracy of the project schedule. They do this by swapping out forecasted start dates with actual start dates. If the difference exceeds the given float, updates to subsequent tasks and the project end-date are reflected in the Gantt chart.
Archbold continues, “As project progress is collected, the network diagram is used to recalculate the schedule. Each week the [project manager] should be able to forecast whether the project end-date can be met.”
What does a PERT chart have to do with critical path?
Critical path helps you shorten project duration.
Along with PERT charts, the critical path method was also developed in the 1950s. Just like Gantt charts, critical path is another tool you can use with PERT to better plan project timelines.
To learn more about using critical path in project management, check out our article, “How Understanding Critical Path Can Drive Project Management Success.“
If you’re trying to shorten the duration of a project, you can use a critical path diagram in conjunction with a PERT chart.
For instance, if you know how long it takes to complete each step of your project, you can use the critical path method to see which task takes the longest. After you’ve visualized your project using critical path, you can then include this information in your PERT chart to show the duration for each task.

Critical path diagram with time estimates in LucidChart (Source)
Ultimately, you can use your PERT chart to help determine and visually indicate the critical path when project planning.
What are some best practices for creating PERT charts?
Keep it simple.
One of the challenges with PERT charts is that they show a lot of detailed information for each task including:
Task name
Planned and actual start
Estimated duration
Name of responsible person
This level of detail can quickly get out of hand when dealing with long, complex projects that have a high volume of tasks with multiple phases and milestones.
According to Patterson, one way to combat this issue is to keep the PERT chart relevant to the audience: “All projects can be represented as hierarchies. A project can be broken down into multiple levels, and so a best practice technique should be [to] report your overall project at a level that doesn’t demand more than, say, 20 nodes.”
How is PERT chart software beneficial to project managers?
Automate processes; reduce manual errors.
The most common way project managers create PERT charts is manually drawing them or using a spreadsheet tool, such as Excel.
However, there are several software solutions available that can simplify and automate the creation of PERT charts.
Let’s take a closer look:
Capabilities and Benefits of PERT Chart Software
Drag-and-drop functionality | Managers can easily create PERT charts by dragging and dropping tasks to different points on a schedule and make updates as required. |
Automatic calculations | Recalculates changes in duration estimates when “planned start” differs from “actual start” and updates items that are affected as a result. |
Integration with other solutions | Visualization tools that integrate with project management software allow for greater visibility and understanding of project variables such as: timeline constraints, resource availability/utility, and potential risk areas. |
Pre-built templates | A PERT chart template can simplify creation and automatic formatting can help your chart look more professional. |
Version control | Makes it easy to share charts with project team members and stakeholders. Especially when using cloud-based tools, updates are reflected in real-time helping keep teams stay apprised of any changes. |
Ready to start incorporating PERT charts into your project plan?
For more information about project planning software, visit our Buyers Guide to read reviews and compare solutions.
Not all project management software includes PERT chart capabilities, so you may also want to look at our diagramming or org chart software catalog to find a program you can use in conjunction with your project management software.
Or, call our project management experts at (855) 998-8505 for a free consultation.
Note: The applications selected in this article are examples to show a feature in context and are not intended as endorsements or recommendations. They have been obtained from sources believed to be reliable at the time of publication.