


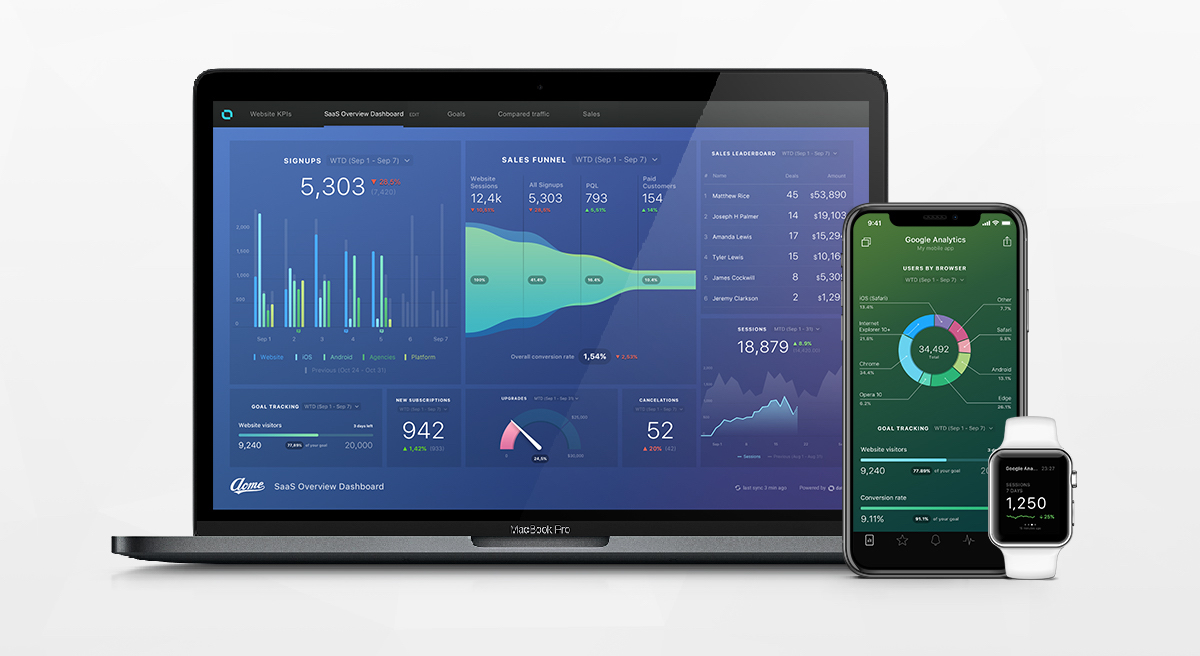
Databox
About Databox
Awards and Recognition
Databox Pricing
Track & improve your performance at an affordable price. We offer a 15-day free trial of any paid plan, no credit card required. We also provide extensive setup help to users for free as part of onboarding. Free: $0, includes up to 3 Data Source Connections + 3 Databoards + 5 users + daily data refresh Starter: starts at $91/month Professional: starts at $169/month Performer: starts at $289/ month Learn more about our pricing & packaging here: https://databox.com/pricing
Starting price:
$47.00 per month
Free trial:
Available
Free version:
Available
Most Helpful Reviews for Databox
1 - 5 of 196 Reviews

Michael
Verified reviewer
Internet, 11-50 employees
Used daily for less than 12 months
OVERALL RATING:
5
EASE OF USE
5
CUSTOMER SUPPORT
5
FUNCTIONALITY
4
Reviewed January 2021
Excellent for tracking all our key metrics in one place
Overall, a great tool for tracking and building boards on high-level metrics.
PROSI love being able to have complete customizable control of my key metrics dashboard. It allows me a daily snapshot of how we're performing. Plus, being able to schedule snapshots be sent to Slack and email, etc. is great. I also love the goals feature, being able to put our metrics into context like this is great.
CONSSome of the integrations are a little lacking, meaning data isn't always super accurate or up-to-date. We definitely cannot use a Databox board as a undisputed source of truth to report on, but rather as a snapshot to see trends. E.g. our Ahrefs Domain Rating is hardly ever correct on the board. I also wish there was a little more functionality within the integrations, the options for what you can pull from ActiveCampaign and Intercom are pretty lacking. And I wish they had a ChartMogul integration too!
Adela
Online Media, 11-50 employees
Used daily for less than 12 months
OVERALL RATING:
4
EASE OF USE
5
VALUE FOR MONEY
5
CUSTOMER SUPPORT
5
FUNCTIONALITY
5
Reviewed December 2022
Great Product and Support!
Overall, It's very friendly to use, especially the way to organize templates to share across client accounts, create alerts, and native integrations with the most used platforms. A Big shoutout to the support team, which is responsive and ALWAYS resolves my questions/issues
PROSI love to centralize the KPIs in one place. While running campaigns through multiple platforms, Databox helps to create and calculate metrics to summarize all impressions, metrics, conversions, spending, etc. I am showing data in a fancy and easy way to monitor the metrics' performance.
CONSI've noticed some glitches. 1) After data is updated automatically, sometimes the dashboard doesn't seem to be updated, and to get the data updated, I need to change the date range and get back to the previous date range. 2) In the table settings >> multiple metrics can't sort based on the metric only manually; it would be great to sort dynamically ascending or descending3) I can't view log changes, Ex. If another college works on the same board, I can't see my changes vs. theirs.
Reasons for switching to Databox
Because the native connectors were only focused on Google Products and forced to have the Supermetrics license, which got very expensive (they upgraded the subscription to packages). Also, the visualization in GDS is very plain and simple.

Zachary
Verified reviewer
11-50 employees
Used daily for less than 6 months
OVERALL RATING:
3
EASE OF USE
4
VALUE FOR MONEY
4
CUSTOMER SUPPORT
3
FUNCTIONALITY
3
Reviewed February 2018
Databox: Close, but no cigar...or even cigarillo ...
I work as the Director of Marketing Strategy at DD, which is an inbound marketing agency that services nonprofits and higher education institutions. We're a HubSpot certified partner agency and we were looking to Databox to help us make our client reports quicker, more interactive, and more robust. Databox's clean user-interface makes it really easy to notice trends...it also updates in almost real-time (if not real-time) which is helpful. The customizable dashboards are helpful as well...and there's no doubt that this tool is affordable to agencies like DD who need to report on a wide variety of metrics for 20+ accounts.
CONSWhile there are definitely some pros to Databox, there are also some key features that they are missing. For example, you can't customize date ranges for reports. You have to choose from a weekly, monthly, quarterly, or yearly basis...but you can't choose "Feb. 3 2017 - Feb. 23 2018" for example. This makes reporting very challenging if, for example, you start an inbound engagement with a client during the middle of the year and want to report on 6 month efforts and 12 month efforts that don't align perfectly with the Jan - Dec calendar year. Additionally, while the user-interface is clean, it's almost TOO white...our clients have found it really difficult to discern between traffic sources and points in time. All of this is to say, I'm highly skeptical of reporting tools that don't let you customize the date and time of your reports...While Databox looks like 2018, it functions like 2010. We have cancelled our services as of now, but I have written emails and social posts to their product team and have encouraged them to "fix" the product and then come sell it to me again...
Anonymous
11-50 employees
Used daily for more than 2 years
OVERALL RATING:
4
EASE OF USE
5
VALUE FOR MONEY
5
CUSTOMER SUPPORT
4
FUNCTIONALITY
4
Reviewed August 2021
Robust Reporting Platform
Databox is highly customizable, allowing for white-labeling, custom reporting, and and offers a wide selection of native datasources that you can sync with out-of-the box.
CONSUnfortunately, their customer service can be a bit slow to respond to requests. Also, for more manual reports that utilize lots of texts and screenshots, there isn't much customization available to format text and images. This can make for reports that don't look great.
Reasons for switching to Databox
NinjaCat's UI wasn't great for creating custom reports and bringing in outside datasources. Also, the software crashed frequently and had too many bugs that slowed down our agencies reporting.
Laura
Marketing and Advertising, 11-50 employees
Used monthly for less than 12 months
OVERALL RATING:
5
EASE OF USE
5
VALUE FOR MONEY
5
CUSTOMER SUPPORT
5
FUNCTIONALITY
5
Reviewed June 2022
Great User-Friendly Reporting Software!
Databox is an extremely user-friendly, helpful data visualization tool that keeps all of your data in one beautiful report. It's so easy to provide insights to clients and it is an essential reporting software to our advertising agency.
PROSThe ability to share a report dashboard link directly with clients was an absolute game-changer. Not only do we have beautiful reports with clearly defined metrics and KPIs, but we also have live dashboards that answer any client questions on the spot. It is easy to create, maintain, and update dashboards throughout the month. Great reporting software for agencies!
CONSThe integrations to data sources are wonderful, however, there seems to be a lag with the data– the numbers don't always align with the live metrics we see in our ad platforms. We are an agency that loves data, so I wish you could customize the date ranges more than simply daily, weekly, or monthly. Overall, great software with very minor cons.
Reasons for switching to Databox
We wanted a more simple, streamlined software to make well-laid out reports for our clients.


