


Zegami
About Zegami
Most Helpful Reviews for Zegami
2 Reviews
Maria
Research, 11-50 employees
Used weekly for less than 12 months
OVERALL RATING:
5
EASE OF USE
5
CUSTOMER SUPPORT
5
FUNCTIONALITY
5
Reviewed December 2019
Zegami's functionality review
The overall experience with Zegami has been great! I really like using the software and it helps spots trends in my data much quicker than in any other way. I think is very visually pleasing and easy to use.
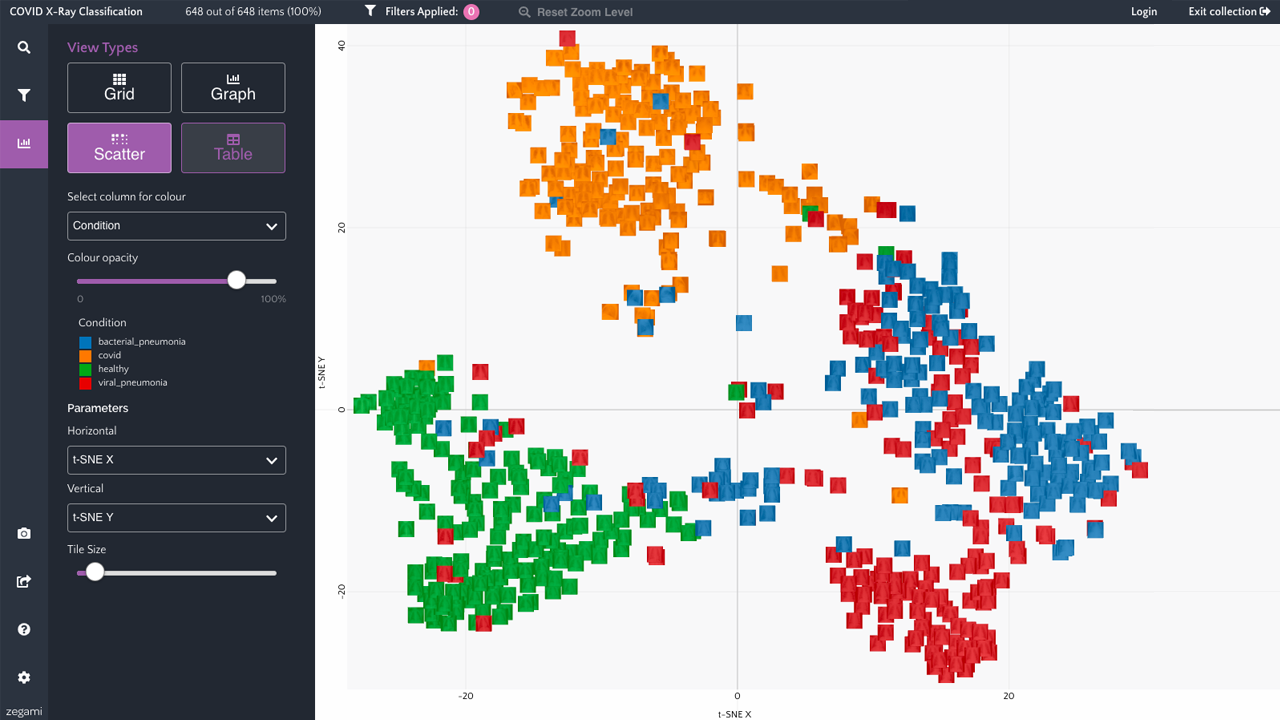
PROSWhat I like most about the Zegami software are the different views one can have of the data, especially the graph and scatter view and the fact that one can change the axes. I also like the filtering functionality and also the fact that is so easy and smooth to create a collection and also edit it.
CONSSometimes the zoom functionality is not working as I would like e.g. sometimes it zooms too much into a tile and some other times it zoome and shows 4 half tiles.
George
Used free trial
OVERALL RATING:
4
EASE OF USE
4
CUSTOMER SUPPORT
5
Reviewed March 2015
We are really excited about Zegami!
The first image collection we loaded into Zegami is an experiment looking at nitrogen use in wheat growth. With our existing tools, we were able to see a significant drop in the Projected Shoot Area measurement on day 60 of the experiment. (Projected Shoot Area is the area in pixels of the plant viewable in that 2D image.) Looking at the images one-by-one, our initial reaction was that the drop was due to the plant entering the next phase of development - when energy goes from growing leaves into producing flowers. It wasn't until we used Zegami to look at the surrounding images that we realised that they actually looked much brighter. A bit more investigation turned up the fact that our imaging system had stopped for 3 hours in the early morning before being corrected. This meant that almost half of the nearly 500 plants were imaged in the middle of the day instead of the early morning for that day. While this outage had been noted somewhere, it wasn't expected that the changes in ambient light would have had such a drastic effect on the analytical results and Zegami made it incredibly easy to track down this blip in the results.
Vendor Response
Thank you for the feedback!
Replied November 2019