


SAS/GRAPH
No reviews yet
Overview
About SAS/GRAPH
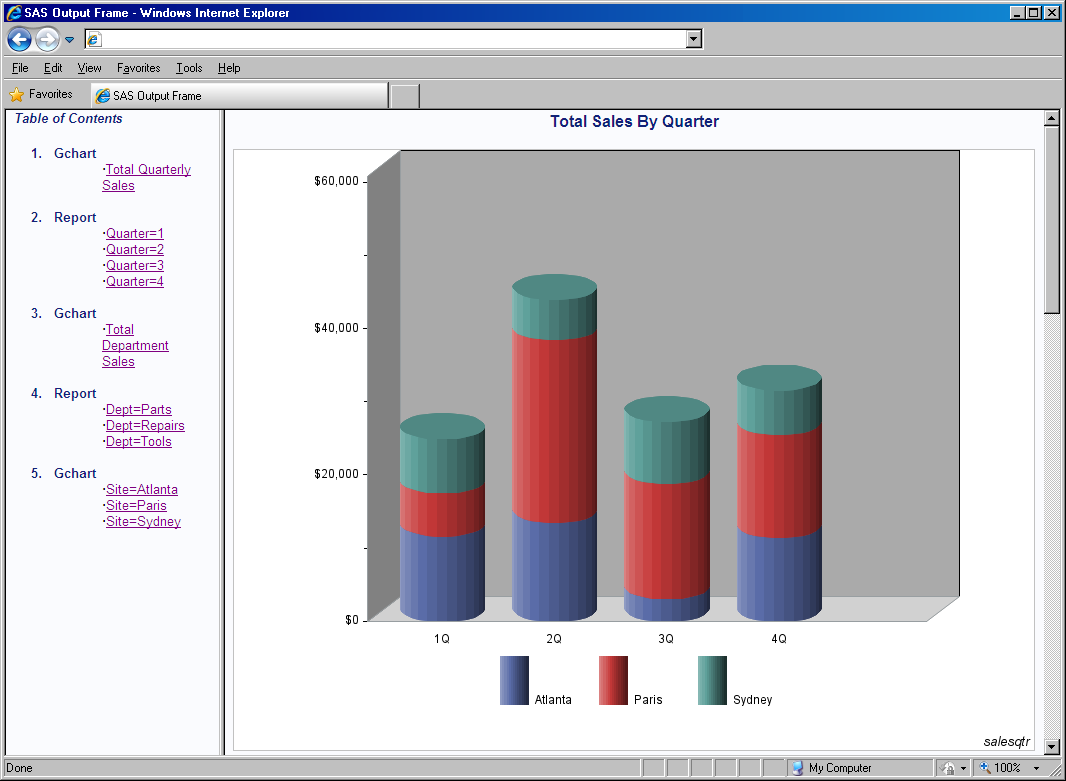
SAS/GRAPH is a data visualization tool that allows users to create customized graphs. The software can organize data as two- and three-dimensional graphs, including charts, plots, and maps. SAS/GRAPH can be used to generate a variety of graphics that supports several business use cases. Users can customize text fonts, colors, patterns, line styles, and other graph elements.
SAS/GRAPH Pricing
Please contact SAS Institute directly for pricing information.
Free trial:
Not Available
Free version:
Not Available
Other Top Recommended Business Intelligence Tools


Be the first to review SAS/GRAPH
Share your thoughts with other users.