Vizlib
About Vizlib
Vizlib Pricing
Free trial:
Available
Free version:
Available

Most Helpful Reviews for Vizlib
1 - 5 of 14 Reviews
Marco
Verified reviewer
Information Technology and Services, 11-50 employees
Used daily for more than 2 years
OVERALL RATING:
5
EASE OF USE
5
VALUE FOR MONEY
5
CUSTOMER SUPPORT
5
FUNCTIONALITY
5
Reviewed February 2022
Vizlib makes Qlik more powerful than ever!
We use Vizlib to improve the storytelling and navigation through the data. We also use it to fill the gap to writeback data intoo DBs and archives after an elaboration with Qlik. The use of Vizlib with Qlik is a perfect combination of powerful of platform and functions
PROSThis suite offer a lot of features that permit to extend the standard Qlik dashboards with a tons of powerful extensions and customizations.
CONSThe licensing model could be more flexible, adding a single user license, not only a packages of them.
Oleg
Information Technology and Services, 2-10 employees
Used daily for more than 2 years
OVERALL RATING:
5
EASE OF USE
5
VALUE FOR MONEY
5
CUSTOMER SUPPORT
5
FUNCTIONALITY
5
Reviewed March 2022
Vizlib - for the most sophisticated dashboard developers on the Qlik Sense platform
I'm a BI Consultant, working with the Qlik tools. Almost all of my Qlik Sense clients use Vizlib to enhance their visual experience with their dashboards. For me, the tool is invaluable and it's practically a necessity.
PROSQlik Sense users and developers know that along with phenomenal data crunching engine and robust performance, the user interface is quite "pre-packaged" with mostly pre-defined visual settings such as fonts, colors, formatting options, etc. This was done with the goal of making the tool as user friendly as possible. Vizlib brings the (lacking) control over the look and feel of the dashboards back into the hands of professional dashboard developers. With Vizlib, your Qlik Sense dashboards will look nicer, have more intuitive navigation, allow data entry and writing back to a database, allow collaboration and self-service, and more and more and more...
CONSThe price for increased control is having to deal with more settings. Naturally, all the settings that control look and feel, take time to go learn and manage on every dashboard. So, the least pleasant part is scrolling through hundreds of settings, looking for the right one. Vizlib mitigates the problem by having templates with pre-defined settings and default settings that come with every object. Also, the ability to search within the Settings forms, helps a lot with the task of finding the right setting when you need it.
Jochem
Research, 11-50 employees
Used daily for more than 2 years
OVERALL RATING:
3
EASE OF USE
4
VALUE FOR MONEY
4
CUSTOMER SUPPORT
5
FUNCTIONALITY
4
Reviewed February 2022
My review on the Vizlib products
Overall experience as a vizlib legend is very good. Support for different questions are solved or answered in a very professions and fast way. Feature request are taken seriously and i love the personal approach from different employees in different roles.
PROSAs a Consultant we need lot's of properties, well have a look at Vizlib's properties panels and you know why we love it, and the fact that there is vizlib a search filter on the properties says it all! Lot of properties means a lot of features, so for a consultant vizlib is like a candy box.
CONSwhat i still don't like is the fact that there still is a Climber part and a Vizlib part, so Self Service is climber and the other visual are vizlib library. I think they should be merged into on license and the visual part for climber (example Toolbar) should be taken to the Vizlib high level standard, and maybe some vizlib components should functional be on the Climber level.
Reason for choosing Vizlib
For end users installation and configuration should be simple and should look good. UI and configuration are possible with Widgets and property panels look very good. For end users this is often a no brainer.
lee
Hospital & Health Care, 11-50 employees
Used daily for more than 2 years
OVERALL RATING:
5
EASE OF USE
5
VALUE FOR MONEY
5
CUSTOMER SUPPORT
5
FUNCTIONALITY
5
Reviewed February 2022
Outstanding Product - best visualisation product on the market
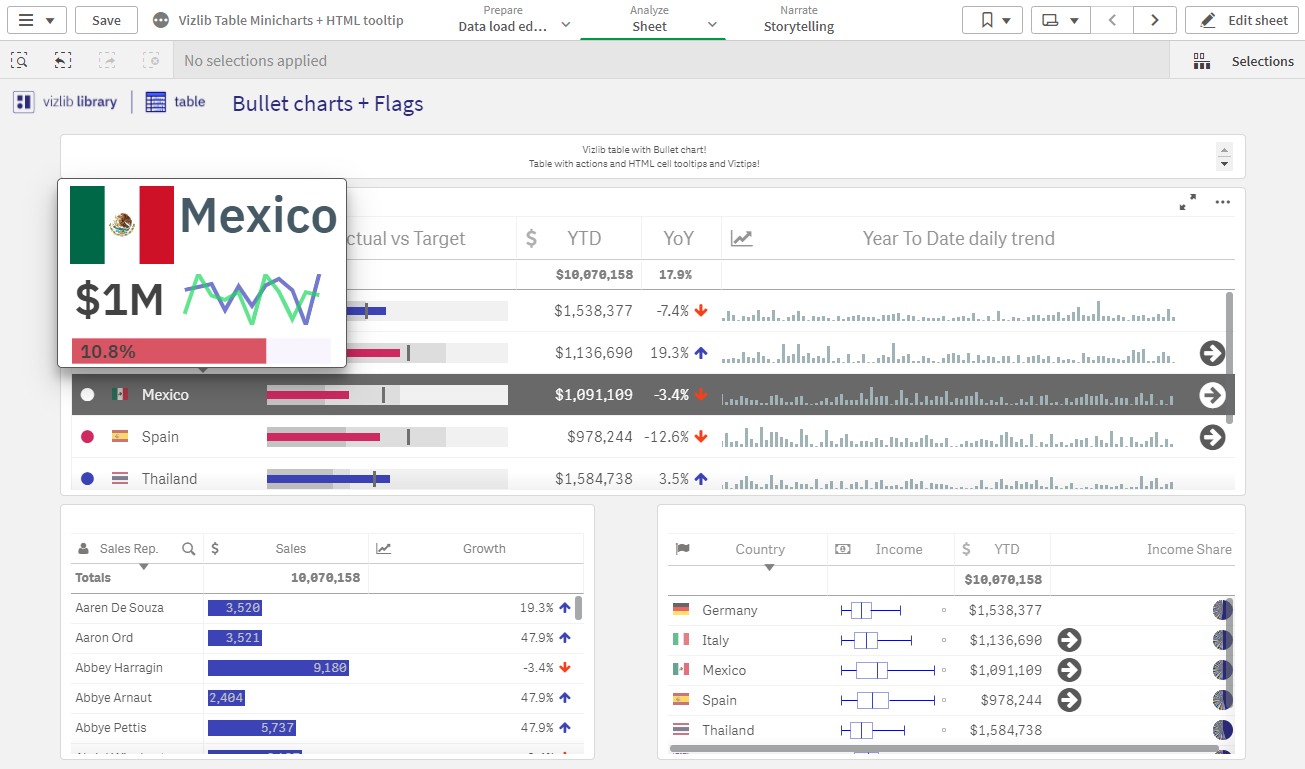
I love everything about VizLib visualisations and the company... every member of the team is great, always helpful, knowledgable and supportive. the products are literally a developers dream and certainly an amazing basket of goodies, when a client asks for something i know i simply turn to a vizlib product and it will be there, if it isn't then the feature request pages are awesome as i raise a request for a new feature and kept informed as to how long it will be. My go to product is the KPI designer, its simply ingenious, i can design whole pages, single objects are even layer objects within objects making it super cool. the ability it has with the KPI tooltip on charts to hover a chart and it display a bespoke KPI popup is incredible.
PROSMy go to product is the KPI designer, its simply ingenious, i can design whole pages, single objects are even layer objects within objects making it super cool. the ability it has with the KPI tooltip on charts to hover a chart and it display a bespoke KPI popup is incredible.
CONSsometimes the speed of some items, but Vizlib are continually improving these speeds, would be great if performance was sometimes the focus and not always the quality of the finer details
Angelika
Information Technology and Services, 11-50 employees
Used daily for more than 2 years
OVERALL RATING:
4
EASE OF USE
4
VALUE FOR MONEY
5
CUSTOMER SUPPORT
5
FUNCTIONALITY
4
Reviewed March 2022
Most valuable way to add value and context to the visualizations
Vizlib gives that extra to create amazing dashboards, reports in al kinds of ways, it is easy to use, te documentation is in place, we can realy drive and help organizations to work with visualizations that they understand, just by giving them the extra context .
PROSI am a big fan of the products, being able to add that extra context to the visualization to help the readers of that visualization actually understand what they are looking is the main reason With the value adding products we can add more variety in the reports that we create for our readers, users. Love the fact even, that we van discuss improvements of visualizations, or give ideas to work on for the future.
CONSSometimes, but I know it is constantly on the top of mind, the loading of the product (sometimes it is a bit slow)
Reason for choosing Vizlib
ease of use, comleteness of product, support which is in place, the help & assistance if you need it, they are listening to suggetions and improvements etc.
