FYI on KPIs: 3 Steps to Better Supply Chain Metrics for Your Small Business
Key performance indicators (KPIs) are metrics used by all kinds of businesses to measure performance against operational goals in order to determine whether they’re succeeding or failing. It’s common knowledge that businesses that do not track performance metrics are destined to fail.
When it comes to actually setting those goals and figuring out which metrics to track, things might, understandably, look a little daunting. If that’s the boat you find yourself in at this moment, don’t worry.
In this article, you’ll read about three steps to help you identify which metrics to track, structure those metrics, define how you’ll measure them and implement your new KPIs to drive peak supply chain performance.
Here they are:
Step 2: Organize Your New KPIs
Step 1: Make a Plan
This is the part where you determine where you are currently, where you’d like to be eventually and how you’re going to get from here to there. You might be tempted to start out by listing all of the metrics you currently track, but that’s likely to leave you really overwhelmed.
If you start the process by trying to decide which existing KPIs to eliminate, you’ll probably find yourself arguing in circles over the pros and cons of each individual metric, and that’s a time waster.
Instead, try taking a “clean slate” approach. Spend time brainstorming these questions:
1. What do you want your business to look like in the future? What will success look like in five years? Ten years? Twenty years? Consider things like production volume, inventory, sales, cash flow and management, order processing and demand forecasting.
2. What steps in the end-to-end supply chain will be critical to achieving that future vision? Is your goal to increase production so you can meet demand quicker? Can’t do that without excelling in manufacturing. Do you want to grow your business and retain more employees? You’re going to need a great human resources department. Need to lower your landed cost? Let’s talk about sourcing better suppliers.
Once you’ve got an idea of what processes you need to monitor, start listing KPIs that will help you do that. During this step, it might help to bear in mind a few important elements of metrics. Good KPIs are typically:
Quantitative. Easy to represent with numbers.
Practical. Related to current company processes and simple to integrate.
Directional. Able to identify trends to show either improvement or decline.
Actionable. Specific to individual processes so you can see exactly where to make changes if need be.
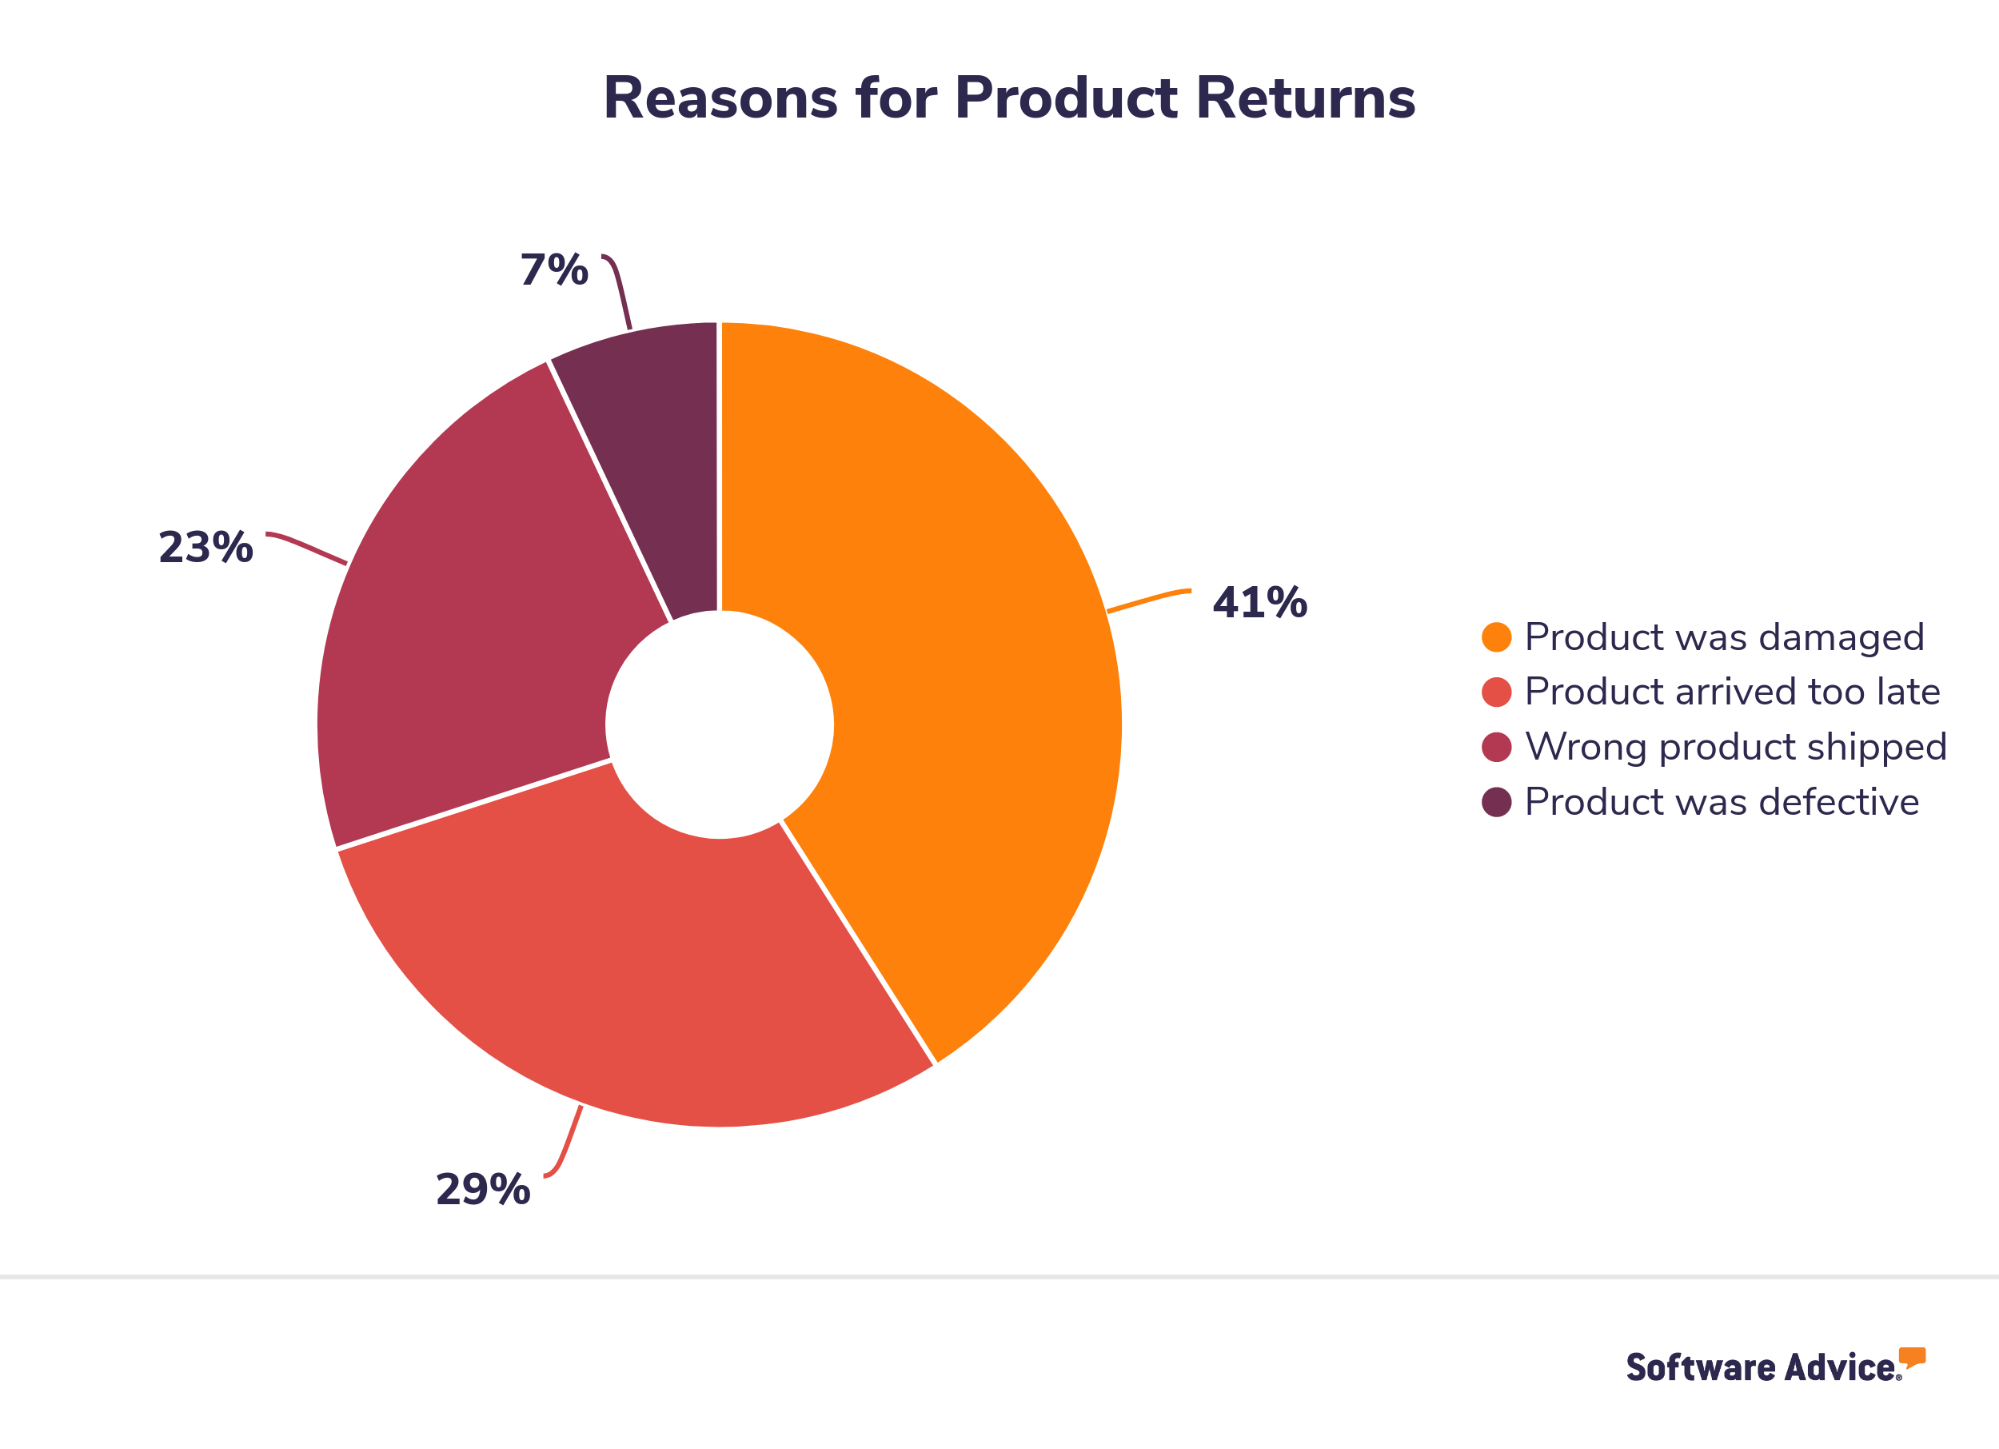
Example KPI: Rate of/Reason for Returns
Tracking how often customers return products and why is an easily implementable metric that can be shown in numbers (actual or percentages), tracked over an extended period of time and used to identify specific problems and initiate solutions.

This example data indicates specific areas for improvement—delivering the product on time and preventing damage during shipping— that can now be addressed.
Once you’ve outlined all of the supply chain metrics you want to track, you’ll be ready for the next step.
Step 2: Organize Your New KPIs
Here’s the important thing to know about this step:
All of your KPIs are interconnected. Understanding how they work together and affect one another will be the key to structuring and prioritizing your performance metrics.
Say you want to track your cash-to-cash cycle time. That seems easy enough on the surface, but you also have to recognize that things like inventory levels, demand forecasting and rate of returns will all impact that cash cycle.
Way back in 2004, Gartner published an infographic called the Hierarchy of Supply Chain Metrics (content accessible to Gartner members). This organizational tool was defined by its creators as “a tiered system of metrics to improve supply chain effectiveness.”
That model was based on research and data collected from dozens of global supply chain companies, and it served to highlight commonalities among those diverse organizations as well as structure them in a way that other supply chains could learn from and implement them.
Over the years, Gartner’s model has grown in popularity and use. While it is directed towards massive organizations more than small and midsize businesses, it’s still a valuable tool for smaller businesses to help with identifying and strengthening KPI strategies.
To that end, I’m going to go over a modified version of Gartner’s hierarchy that’s adjusted for small businesses like yours.

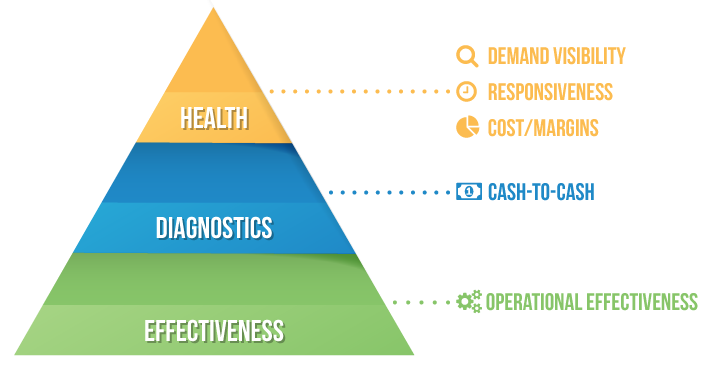
Hierarchy of supply chain metrics for small and midsize businesses
Now, let’s break it down a little and find out why the pyramid is organized this way. The tiers are separated to reflect operational levels of the supply chain and which metrics should be tracked on those levels.
The levels work together from top to bottom to give you a broad, zoomed out view of your entire supply chain, and the KPIs you decide to track within each level will work together to give you drill-down tools to identify problems or bottlenecks along your supply chain.
Now, let’s talk about what kinds of metrics go in each tier.
Tier 1: Supply Chain Health
Think of this as the executive level of your supply chain. Here’s where you’ll group the metrics that help you see the big picture and get an idea of how well your company is balancing profit and spending. Three metrics that belong in this tier are:
Demand forecast accuracy (DFA): the difference between forecasted and actual demand.
Perfect order: the rate of orders that are accurate, on time and in perfect condition.
Supply chain management cost: the sum of all supply chain operating costs represented as a percent of revenue.
These metrics combined will help you predict perfect orders and see any performance tradeoffs you’re making.
Tier 2: Supply Chain Diagnostics
This level of the pyramid focuses in on accounting and cash flow to show you exactly where your money’s going. By following your money, you’ll get a clear view of how in sync your inventory levels and expenses are. Three metrics to think about on this level are:
Days payables outstanding (DPO): the length of time between receiving your raw materials and paying for them.
Inventory total: amount of inventory on hand.
Days sales outstanding (DSO): the length of time between invoicing your customers and receiving their payments.
These metrics combined show where you stand with revenue and whether or not your revenue is keeping pace with your expenses.
Tier 3: Supply Chain Effectiveness
This is the boots-on-the-ground level of your supply chain, where you can see detailed data about how well your suppliers are serving you and how well you’re serving your customers.
This is where you get to start being selective (and thoughtful!) about which metrics to include based on the nature of your business. A few you might want to consider include:
Supplier Quality
Supplier On Time
Raw Material Inventory
Purchasing Costs
Direct Material Costs
Cost Detail
Production Schedule Variable
Plant Utilization
Work in Progress/Finished Goods Inventory
Order Cycle Time
Perfect Order Detail
All of the metrics you select for this tier should combine to show you the root cause of any issues you might be having and where you can implement quick and precise fixes.
Step 3: Set Your Goals
That was a lot. But the hard part is over and now you’re just one step away from implementing these new KPIs. Here’s the important thing to keep in mind: Supply chains are segmented by nature, so it’s crucial that your KPIs are clearly communicated, consistent and tracked across the entire company.
The steps along the supply chain differ in major ways like purpose, processes and goals, but you don’t want to over-segment your KPIs. The idea is to unify your supply chain under common and overarching goals so that everyone is on the same page.
Start by setting big targets for your entire business, then you can break those big goals down and assign their parts to the corresponding stages of your supply chain.
After that, the key will be communication. Make sure you’re announcing your company-wide goals to everyone loud and clear, and that every last employee knows what they should be tracking and how their performance fits into the bigger picture.
This is also the time in the process where you figure out what your benchmarks are for each KPI. There are different ways to calculate those thresholds between success and failure; for instance, once you collect data over a certain period of time, say a quarter, you can set new targets to beat your previous averages.
Example of benchmarking your KPIs:
Over the next three years, you want to reduce your supply chain management cost by six percent. You’ve crunched the numbers and found that you can bring down your purchasing and transportation costs enough to achieve this goal if you can 1) get a better rate from or find a different supplier and 2) better optimize route picking for deliveries.
You make the tradeoff to invest in strategic sourcing and fleet management software, and then establish and communicate yearly targets to those departments to track that progress.
That’s It!
By following those three steps and keeping your specific business needs in mind throughout the process, you can improve your performance metrics and data collection for a more complete, useful view of your supply chain operation. Remember the key takeaways from each step:
1. Start with a clean piece of paper and an idea of what you want your company to look like.
2. Take the time to understand how all of your KPIs relate to one another.
3. Set your targets and make sure everyone knows how they’re going to hit them together.