
Decision Tree Software vs. Decision Tree Analysis in BI Tools
Money might not grow on real trees, but decision trees can definitely grow your revenue.
Decision trees may sound like a complex topic, but they’re not unlike a “Choose Your Own Adventure” story.
They branch out according to the choices you make. It’s a pretty common and simple form of business analytics.
Cover of Treasure Hunt by Alan George is licensed under CC BY 2.0
Not all decision trees are created equal, however. Some are merely fancy diagrams, whereas others use advanced algorithms to help you predict the impact of decisions.
Essentially, there are two types of decision trees:
DIY decision trees that are created by a human being.
Automatically generated decision trees that are created by algorithms in order to classify data in a data set.
Here, we’ll explain the difference between these two types of decision trees and make some recommendations about how to use each type.
Here’s what we’ll cover:
You Don’t Need Dedicated Software to Make Decision Trees
You Do Need Software to Classify Data With Decision Trees
You Don’t Need Dedicated Software to Make Decision Trees
In the most basic terms, a decision tree is just a flowchart showing the potential impact of decisions.
The purpose of a decision tree is to break one big decision down into a number of smaller ones. A business can then choose the best path through the tree.
If you’re making a decision about one or two variables, you probably don’t need to create a flow chart to analyze it.
But say you have more than five variables. At this point, the potential impact of the decision becomes too complex to solve with mental math, and a flowchart can help in analysis.
Take the following example. It’s a decision tree I built in Excel for a digital marketing department trying to plan how many landing pages to create. It factors in the revenue gains as well as the costs of creating different numbers of landing pages over two financial quarters:
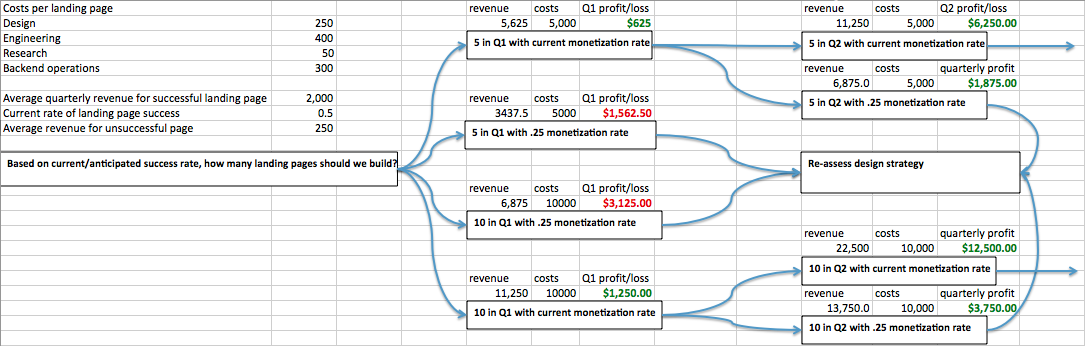
Used with permission from Microsoft
Of course, you don’t even need to use Excel to create decision trees. Excel is just an easy tool for this type of analysis, since you can use formulae to calculate the impact of each decision.
The point of decision trees, as stated in a classic HBR article, is “laying out what management knows in a way that enables more systematic analysis and leads to better decisions.”
In fact, you don’t need software at all—a whiteboard or a chalkboard will serve you just as well as one of the many tools out there that are marketed as “decision tree software.” At the end of the day, these tools are basically nothing more than visual design aids.
The major use case for the free decision tree software floating around online is creating decision trees for presentations.
However, decision trees can be used for much more than slideshows if you take them beyond simple diagrams.
You Do Need Software to Classify Data With Decision Trees
Decision trees are used both in decision analysis and in data analysis.
The difference is: When you use a decision tree for classifying data, you grow the tree automatically using machine-learning algorithms, as opposed to simply drawing it yourself and doing all the calculations manually in Excel.
In data analysis, decision trees are used for classification tasks, including classifying the possible outcomes of a decision.
However, decision trees aren’t simply limited to classifying outcomes—they can also classify customers (high value vs. low value, likely to churn vs. unlikely to churn, etc.), website visitors, and a host of other data sets used in digital business.
Tapan Patel, principal product marketing manager for business intelligence and analytics at SAS (a leading developer of solutions for statistical analysis), explains that in decision tree analysis, “you break a decision down using a target value.
For instance, you can say ‘I want to figure out who buys this product.'” In this case, whether a customer made a purchase or not is the target variable.
You can also target variables that are less obvious. For digital marketers, for instance, Patel notes that it’s important to know whether website visitors download materials such as white papers, as this behavior indicates that site visitors are more likely to purchase the product.
Thus you can create a decision tree showing which visitors are most likely to download a white paper by feeding data about your website visitors into an algorithm.
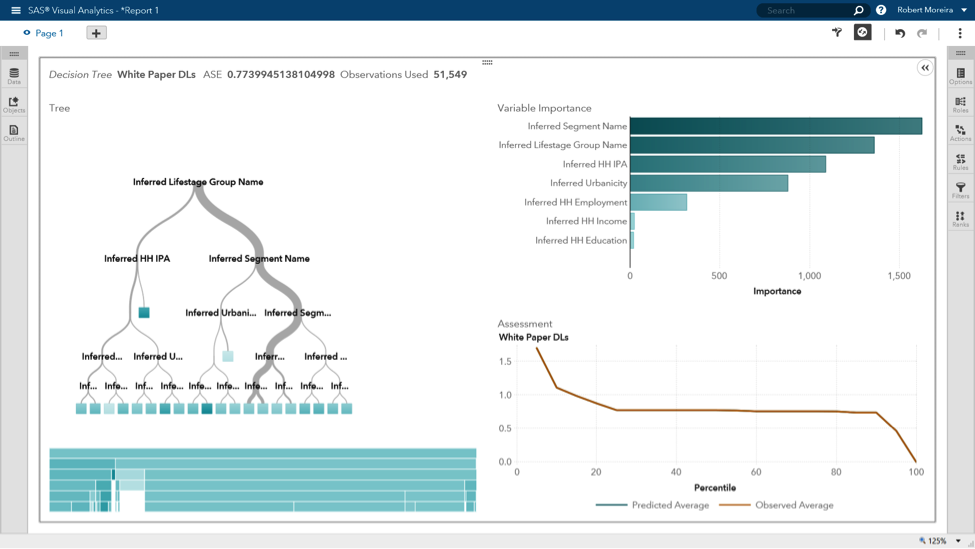
Decision tree in SAS Visual Analytics
The groups into which a decision tree splits your data are called “nodes.” Patel explains that in SAS Visual Analytics, you can simply click on a node to inspect the criteria that the decision tree algorithms are using to classify your data (age, inferred income level etc.):
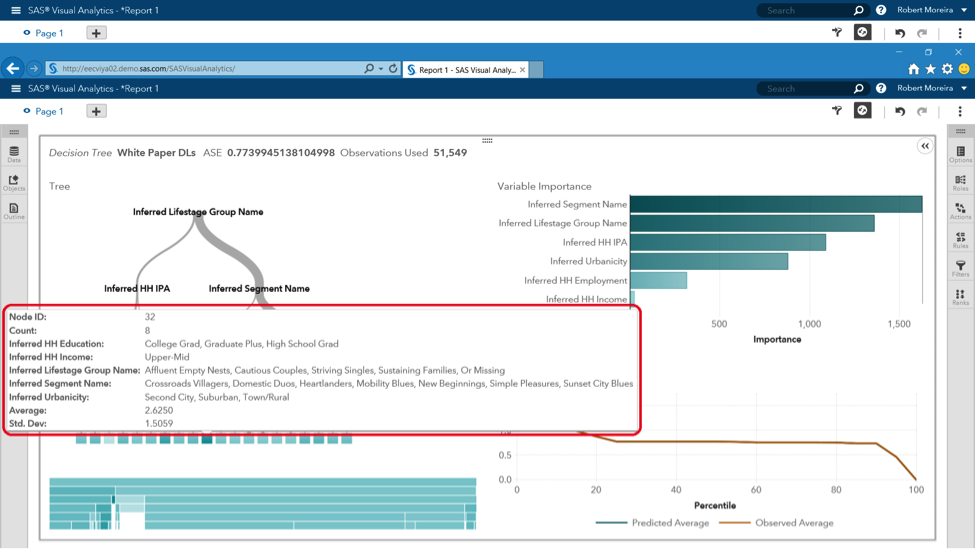
Inspecting classification criteria in SAS Visual Analytics
This functionality is the major benefit of decision-tree classification.
With other algorithmic approaches to customer segmentation, such as clustering, it can be tough to understand the groups into which the algorithms divide your data. With decision trees, you get a neat list of criteria, as in the above screenshot.
Once you’ve performed segmentation analysis, you can move on to developing better strategies for targeting and retaining high-value customer groups. One advanced way of doing this is through real-time personalization of the customer experience.
Patel notes that SAS has the ability to generate “score code” from the decision tree—i.e., code that allows you to “score” new site visitors according to the analysis you performed. In our example, you can score how likely visitors are to download a white paper.
These scores can then be applied to website visitors in real time, using technologies such as event stream processing and business rules engines.
Patel clarifies that in event stream processing, “as the website collects the data, we can actually filter data in seconds to create decisions for us,” whereas a business rules engine is used “to execute these decisions in real-time.”
These technologies are complex to understand, but essentially they take the scores from your decision tree and analyze streams of real-time data from your website to apply scores to each customer. They then tailor the website experience in real time to each visitor using the score.
For instance, you can serve a pop-up advertising a white paper download to customers scored as the group most likely to download the white paper based on age range, education level etc.
For customers that are scored as unlikely to download the white paper, you can choose a different option such as an email newsletter subscription.
BI vendors that support decision tree analysis include:
Conclusions
For beginner marketers, drawing your own decision trees and performing calculations in a tool such as Excel is a good way to analyze complex decisions and spice up presentations.
For advanced marketers and business analysts, decision trees are one of the most effective ways to classify complex data sets, such as customer and website data, in order to answer questions like “which customers are likelier to buy our products than others?”
More than just serving as analytical tools, decision trees can now be used together with event stream processing, rules engines and other technologies to personalize the customer experience in real-time.
While you might not be ready to take this step yet, it’s worth thinking about how you might use this technology before your competitors force you to use it or perish.