Grafana
About Grafana
Awards and Recognition
Grafana Pricing
Starting price:
$29.00 per month
Free trial:
Not Available
Free version:
Available

Most Helpful Reviews for Grafana
1 - 5 of 59 Reviews
Francisco
Verified reviewer
Computer & Network Security, 11-50 employees
Used daily for more than 2 years
OVERALL RATING:
5
EASE OF USE
5
CUSTOMER SUPPORT
4
FUNCTIONALITY
4
Reviewed February 2024
Why we have to use Grafana?
It's "The daily tool" to review, server status, service status, backups status. It's the 'must have' tool for viewing the status of servers.
PROSIt's very easy to mix different data and create different graphs. Now it's possible to make graphs and mix with images, SVG images. All of this in a very intuitive way.
CONSIt's not possible to make granular permissions in the versions we use.
Reason for choosing Grafana
It's very simple to use and there are many examples on the website.
Reasons for switching to Grafana
Zabbix gets the data and we use Grafana for visualize.
Jurgen
Verified reviewer
Education Management, 501-1,000 employees
Used weekly for more than 2 years
OVERALL RATING:
4
EASE OF USE
5
CUSTOMER SUPPORT
3
FUNCTIONALITY
4
Reviewed August 2023
Review from college - Howest
Grafana was the first visualization tool we used with our students. We are still using it because it makes it possible to explain the whole visualisation process of data. Starting from getting data in a database to make realtime visualizations and error reporting possible. Due to real time visualization of the data, we can make savings in the company. Next to that we can make calculations of optimization possibilities of the campus (heat and electricity) which are very usefull to save more energy.
PROSThe ease of making visualizations with different data sources (ex. influx DB). Easy to make visualizations of energy datasets. We are visualizing all the energy data of the campus on real time base with Grafana. This is very useful to have an overview of the realtime consumption of the different sites. With Grafana we also implement upper and lower limits. When consumption is to high, we try to lower down the consumption of the different processes, depending of the price.
CONSIt is hard to make reports with Grafana. For this reason, for making reports we are using other tools and visualisation software. Next to that sometimes updates are making that some visualisations are not possible anymore. But over the time I use Grafana, it keeps getting better.
Reason for choosing Grafana
Easy in use and having nice visualisation options.
Abhi
Computer Software, 1 employee
Used daily for less than 12 months
OVERALL RATING:
3
EASE OF USE
4
VALUE FOR MONEY
5
CUSTOMER SUPPORT
3
FUNCTIONALITY
4
Reviewed March 2022
My Experience using Grafana
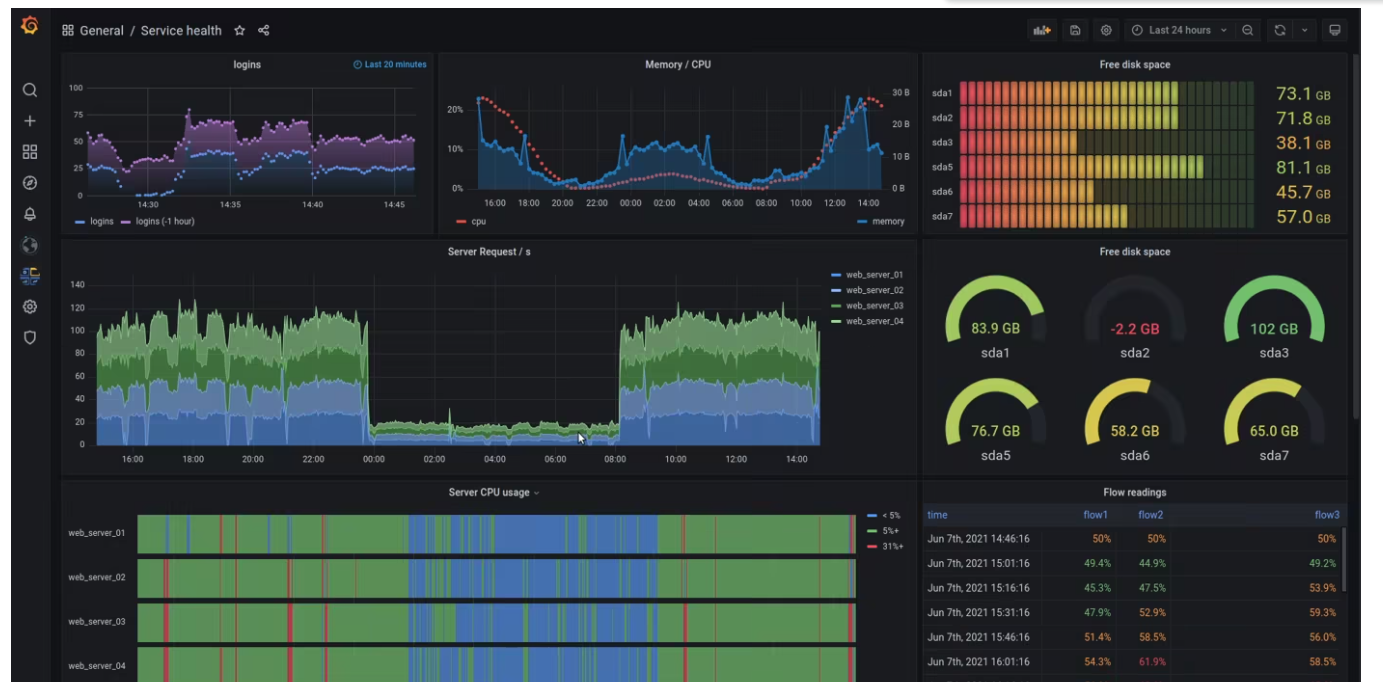
Visualising got easy to manage cloud monitoring services as able to integrate different clouds on the same dashboard. It can be easily configured with most Databases as Relational, Time-Series. The alert system is the most effective one which we can make use of in Grafana to set the Alerts and all.
PROSThe most I like to have this software used as its free to use and also its an open source software. Grafana consists of various kinds of authenticating methods and security level setup. It has a an alert and monitoring tool which keeps on updating after a threshold value for which is set. It has chances of new developments and API interaction, Creation of new measurements and demonstrating concerning different devices
CONSEverything has a limit, as its Limits charts to Time Series, It is not self manageable. The dashboard also has a very limited organisation. The UI isnt that much effective, as its having a very limited designs. It has set its boundaries to time series only, as its not comparitively well organised with respect of other tools in the market such as Power BI etc...
Carlos Hugo Martin
Information Technology and Services, 11-50 employees
Used daily for more than 2 years
OVERALL RATING:
4
EASE OF USE
4
VALUE FOR MONEY
5
CUSTOMER SUPPORT
4
FUNCTIONALITY
4
Reviewed March 2022
Experience with Grafana
Se ha utilizado Grafana para generar dashboards de monitoreo, pudiendo centralizar las métricas de distintas soluciones de monitoreo como Prometheus, Zabbix, etc.
PROSThe ability to generate visually attractive, efficient dashboards that help the operations area understand what is happening on the monitored platforms.
CONSThat different data sources cannot be used in the same graph at the same time, causing a visual comparison of the data to be difficult.
Reason for choosing Grafana
For the price and flexibility of Grafana when generating dashboards.
Reasons for switching to Grafana
Grafana is more flexible when it comes to generating dashboards, plus it has more integration options.
Praveen Kumar
Verified reviewer
Information Services, 201-500 employees
Used daily for more than 2 years
OVERALL RATING:
5
EASE OF USE
4
VALUE FOR MONEY
5
CUSTOMER SUPPORT
5
FUNCTIONALITY
5
Reviewed August 2021
Grafana: Dashboard for everyone
I am very happy with Grafana and it's dashboard and plotting variations of metricises.
PROSIn Grafana it's very easy to create the dashboard and plot the data at the same location from multiple resources. It supports many data sources like Prometheus and Influx database.
CONSIf we need to create custom dashboards, we need to learn JASON language.
Reason for choosing Grafana
Grafana is easy to use and configure for any organisation. It's data plotting matrices are very attractive and eye catching.
Reasons for switching to Grafana
Kibana is taking too much time in plotting the data and data consistency is also an issue with Kibana.


