Prevent Disastrous Downtime With 3 Maintenance Failure Analysis Methods
As companies grow, maintenance teams are pressured to become leaner and more efficient. Overall, maintenance needs to be more proactive.
To evolve your maintenance management capabilities, you must first identify how machines tend to fail. Many maintenance teams don’t utilize or don’t understand failure analysis methods. This leads to preventable downtime, as teams fail to identify the true causes of asset failures.
Gartner maps out a seven-step approach to achieving asset reliability and identifies moving beyond costly run-to-failure “reactive” maintenance as the first step. This requires failure analysis.
 Maintenance managers can use one or a combination of the popular three failure analysis methods to eventually eliminate costly emergency repairs and maximize uptime.
We’ll share when and how to use the methods for the greatest impact on your maintenance efficiency. But first:
How much does asset downtime cost you?
The true costs incurred when a critical machine stops functioning is highly dependent on what your company does. To remedy lost revenue, you must know what downtime actually costs in your particular setting.
Here’s a tool to do that: You can enter information about your operations, such as revenue per hour, how many employees are impacted when a machine goes down or revenue per unit produced for manufacturers.
Simply enter your information in the fields on the right to see your average cost of downtime:
Employee costs per hour: The average employee salary divided by number of hours worked, multiplied by the number of employees.
Average revenue per hour: An estimate of how much revenue your company generates in a given hour.
Employees affected by downtime: An estimate of the percent of employees who would be unable to work due to shut down machinery.
Revenue affected by downtime: An estimate of the percent of revenue lost due to machine downtime.
Number of units produced per hour: An estimate of the number of units produced in one hour.
Average profit per unit: The amount of profit earned for each unit produced.
Number of hours of downtime: The number of hours of downtime expected.
Method #1: Failure Mode and Effects Analysis
Failure Mode and Effects Analysis (FMEA) is a process developed by the U.S. military in the 1940s and used in several industries since. It offers a series of steps that helps reveal the possible ways an asset can fail and which types of failures are most consequential so maintenance teams can address those first.
When to use FMEA: This method should be used whenever your company is designing a new service or process, adding new equipment or changing the application of equipment. It should also be used occasionally throughout the life of an asset to identify any changes in performance.
How to use FMEA: Many versions of this process exist, but it essentially follows a handful of steps to list out and brainstorm about possible ways a particular machine can fail, typically including:
List the processes or assets to evaluate
Identify potential failures
Determine possible effects of failures
Assign a severity ranking for each failure
Assign likelihood of failure
Assign likelihood of detection
Calculate Risk Priority Numbers (RPN)
Establish corrective actions
Maintenance managers will use charts to gather this information. Here are all the elements that must be present in an FMEA chart:
Elements of an FMEA Chart
Process | What is the step you’re analyzing? |
Potential failure mode | How can this process go wrong? |
Potential failure effect | What is the impact of the failure if not prevented? |
Severity | A 1-10 score showing the severity of the impact. |
Potential causes | What are the determined causes? |
Frequency | A 1-10 score showing the likelihood of the failure occurring. |
Current process | What system controls the process (or detects a failure)? |
Detectability | A 1-10 score showing the probability of detecting the failure. |
Risk Priority Number (RPN) | Calculate this in the following way: severity x frequency x detectability = RPN. |
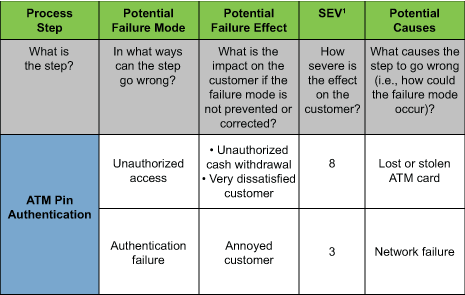
Here is an example of an FMEA chart from iSixSigma:

A portion of a typical FMEA chart (Source)
Machines or processes with the highest RPN failures should be addressed first.
FMEA shares much of the same steps and goals as Planned Maintenance Optimization (PMO):
Choose what assets should be tracked and monitored.
Identify the most effective maintenance plan for each type of machine and failure, eliminating redundant work and adding missing work.
Implement the new maintenance plan.
However, PMO includes the important process of optimizing tasks—Removing redundant tasks that don’t impact the highest risk assets and processes, improving existing tasks that are proven to prevent failures and, finally, adding any missing tasks that can prevent failures.
Method #2: 5 Whys
The 5 Whys method is a simple concept that illustrates the complexity of machines and why root cause failures are tricky to expose. By asking “why” multiple times, you can bypass the symptoms to find the culprit—and in many cases, it’s human error.
Developed in the early 1900s by Sakichi Toyoda, whose son founded Toyota Motor Corporation, the 5 Whys technique has been used by several companies ever since. It is part of the widely utilized lean manufacturing, Kaizen and Six Sigma improvement strategies.
When to use 5 Whys: This method is like a “light” version of FMEA. It’s a lean methodology that simply focuses on a single failure type to identify the specific cause (or more likely, string of causes) that resulted in the failure. Because of this, it’s best to use the 5 Whys for simpler problems or as a beginning step to get some initial information about more complex issues.
As mentioned above, it’s particularly useful to identify causes of failures when human interaction and judgment is involved.
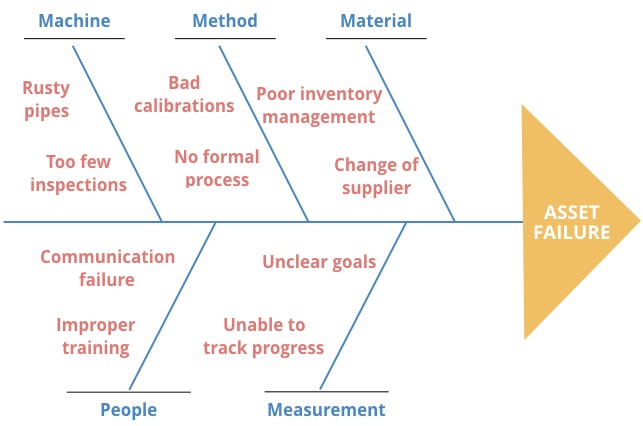
How to use 5 Whys: The Fishbone Diagram (or Ishikawa Diagram) is a visual used with the 5 Whys method to track the potential causes and eliminate each until you reach a true root cause. The most common version begins with “5 Ms”—machine, method, material, people and measurement.
Factors Contributing to Asset Failure

In the graphic, maintenance teams can list all possible contributors along the “fishbones,” which are grouped by types of common factors. Each possible cause can split into more specific causes until the root is identified.
For example, under “Material,” you may find that a change of suppliers created a situation where technicians were missing parts needed to repair the asset, leading to the failure.
The 5 Ms model is commonly used in manufacturing settings, and companies often add three more—mission, management and maintenance—to dig deeper into potential causes.
Method #3: Fault Tree Analysis
The Fault Tree Analysis (FTA) method, created by Bell Laboratories in 1962, allows you to visualize a top-down workflow of a failure, including all components leading to the failure and the likelihood it occurs.
FTA utilizes Boolean logic to organize the various subcomponents in a machine or process so you can clearly see the relationship between components and failure types.
When a root cause, or series of causes, is found to result in the specific failure, the diagram can be used to create more efficient processes that reduce risk and redundancy.
When to use FTA: While the 5 Whys and fishbone diagrams are great ways to reveal causes when human interaction is involved, an FTA method is a stronger tool for identifying complex problems that arise from using more sophisticated machines and processes.
An FTA can be used when implementing a series of new assets that work in conjunction. In these cases, it’s often a handful of factors that lead to failures. Multiple FTA diagrams can be used to trace the various paths from individual components to the failure(s) and document all of the possibilities of improving maintenance tasks.
One important caveat: It’s critical that the maintenance professionals performing the FTA fully understand the machine or process they’re analyzing. Consult OEM manuals or support and include your most experienced personnel to build the most comprehensive, accurate diagram.
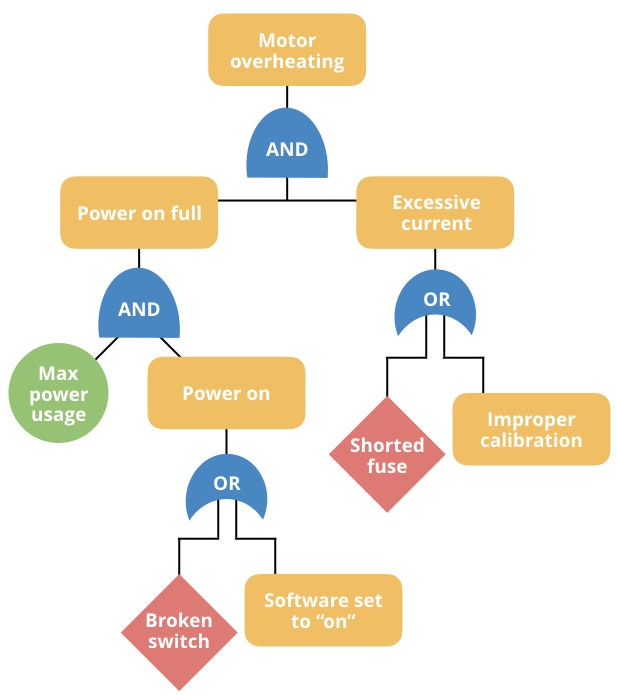
How to use FTA: Starting with the undesired failure at the top of the tree diagram, use a series of events and gates that use Boolean logic to show relationships
Example of a Fault Tree Diagram

A handful of event and gate symbols can be used for most situations:
Events (yellow) represent primary and intermediate events in a series of actions leading to a fault.
Basic Events (red or green) show properties that cannot be investigated further (broken switch, shorted fuse).
Logic Gates (blue) show how two or more events contribute to a subsequent event (“and” and “or” describe the relationship more specifically).
Many more symbols exist for complex processes, and events can be broken down into contributing factors until a root cause is identified.
How can my CMMS help spot root causes?
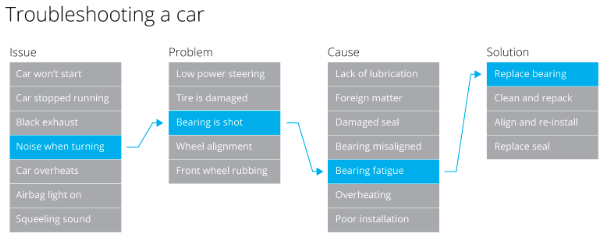
Maintenance management software can assist users with these analysis types—failure codes, for example, that denote corrosion, component failure or overheating can be added to work orders as technicians perform repairs. These codes can then be analyzed to determine the frequency and impact of certain failures.

A series of failure codes in Fiix can be used to trace a failure back to the cause and solution ([_Source](https://www.softwareadvice.com/cmms/fiix-profile/))_
We can help you find the right CMMS to automate the failure analysis process in a couple key ways:
Browse more than 100 maintenance solutions with real-user reviews, pricing and demos.
Or, give us a call at (844) 689-4876 for a free consultation. In 15 minutes or less, our software advisors can suggest a handful of CMMS products that meet your specific needs.