Start Leveraging Data with Manufacturing Visual Management in 3 Steps
Manufacturing managers need to answer many questions:
What is your average cycle time?
Do you know how much asset maintenance costs each year?
What was behind the lag in production capacity last month?
But here’s the most important question: Can you view all of this information in one place?
Industrial analytics is a concept that turns your data into valuable insights for increased manufacturing maturity. But you must uncover all the dark data, the terabytes of data machines generate by production everyday, in order to use it to spot problems and cut costs.
Gartner says asset-intensive companies can find a competitive advantage through leveraging data, and a survey we ran shows that small businesses agree: 53 percent of small businesses say analytics are critical to their business1.
However, many companies let that useful data go to waste. We’ll look at three steps you can take to reveal and analyze data in order to make smarter, data-driven manufacturing decisions.
Here’s what we’ll cover:
3 Steps to Leverage Manufacturing Data
Go Beyond Visualization with Mature Analytics
How Can I Leverage Manufacturing Data?
3 Steps to Leverage Manufacturing Data
Gartner shares several success stories for using data to improve operations:
A manufacturer of medical devices utilized data from machines to double availability while also reducing costs by 30 percent.
A petroleum company remotely monitored equipment across the globe to avoid losing millions in downtime.
A producer of braking systems for trains installed sensors, aggregated data and helped improve acceleration and braking, saving hundreds of thousands of dollars in fuel costs for customers.
Finding your own success with industrial analytics start with three steps.
1. Shed Light on Dark Data
A single turbine can produce 3,500 gigabytes of data per week, and a smart meter can generate 500 million readings each day. The problem is very little of this data is used in any valuable way.
Types of Data Manufacturers Analyze

Only 37 percent of manufacturers surveyed by Gartner say they analyze data from production assets. This means, for many companies, the impact of production and maintenance on the bottom line is difficult to see clearly: Visualizing your production data sharpens your vision to spot weaknesses in production.
Adding sensors and controllers to your most critical machines is the most effective way to see the real benefits of data visualization. The technology is commonly used in the maintenance and facility management spaces.
Sensor technology is much more affordable for smaller manufacturers today, and come in a variety of flavors that deliver a real-time stream of valuable condition data:
Common Types of Sensor Technology
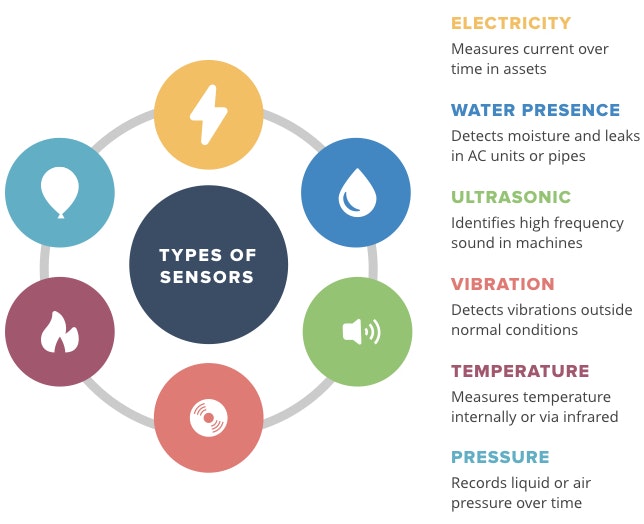
The dark data you can leverage goes beyond the assets on your production floor. Other sources may be the other systems connected to your manufacturing software, such as a supply chain system. Or, maybe you produce products that generate data themselves, then you can gather data from customers.
The term “Big Data” shouldn’t cause anxiety anymore with the sophistication of software and devices available today for manufacturers of all sizes.
RECOMMENDED ACTION: Gather a team to identify the machines and systems you want to collect data from and determine the devices needed to deliver value.
2. Connect IT and OT
While most of the manufacturers who call Software Advice for a new solution already use some kind of software, about 12 percent use manual methods, like paper or spreadsheets.
And nearly 20 percent of all buyers specifically request functionality for stronger reporting, data analyzation and dashboards.
These companies need to translate dark data collected from machinery and other systems into a format that delivers insights. This connection between IT and operational technology (OT) is vital to success.
Much of the data you begin to collect will come in the form of raw data, which needs to be visualized into pie charts, bar graphs and other formats to get any type of useful information from it. If setup correctly, this information will update automatically in near real-time.
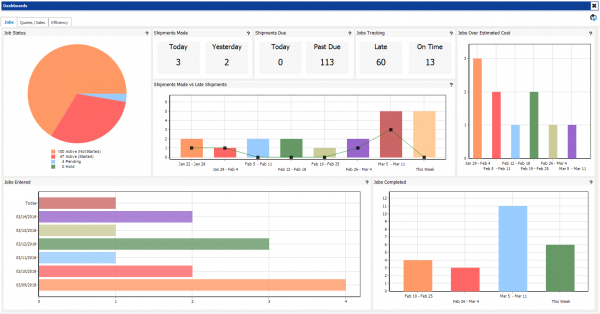
A sample of data visualization options in JobBOSS ERP
And other data can be streamed in real-time. Many of the devices and sensors available today will send condition data in regular intervals throughout the day, which is usually visualized with a line graph.
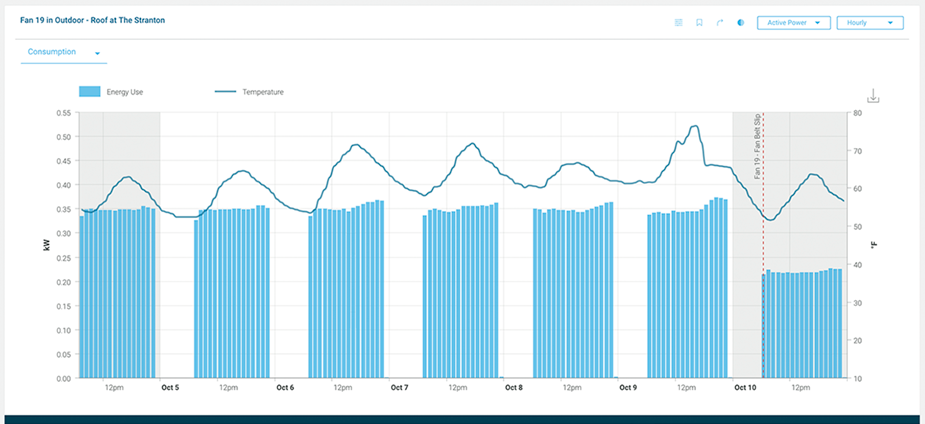
Real-time asset energy use and temperature readings in Enertiv
This is common for maintenance management and predictive maintenance, but can also be used to receive real-time production data.
RECOMMENDED ACTION: Production managers should work with their IT team to determine the type of machine-to-machine communication and data streaming standards (such as SCADA) necessary to collect and deliver readable data from each critical asset.
3. Customize Dashboard to Drive Organizational Goals
You found the data and you’re able to visualize it in a valuable way. Now is the time to customize a dashboard so you can view all the most important information at a glance.
Based on your specific type of production, you probably already know the types of metrics to keep an eye on. These KPIs are important for any kind of manufacturing:
Overall equipment effectiveness (OEE) | Combines the availability, performance and quality of production to convey the health and impact of your equipment. |
Downtime | Measures the percentage of downtime (versus uptime) that production machines are out-of-service. This is the key maintenance KPI, indicating the quality of work to keep equipment running. |
Yield and reject | To track the cost of materials, you should measure the yield rate, the actual output of your production, versus the reject rate, the amount of times products don’t meet quality requirements. |
Cycle or throughput time | This is a measurement of the amount of time it takes from using raw materials all the way to the delivery of the final product. |
Delivery On-Time | Measures the percentage of time that a product is delivered to a customer at the time that was originally committed to the customer. |
These are useful for all manufacturers, but your data visualizations should reveal information that helps you meet the overarching goals of the organization. Management should be involved as you begin visualizing your data to inform your dashboard customization.
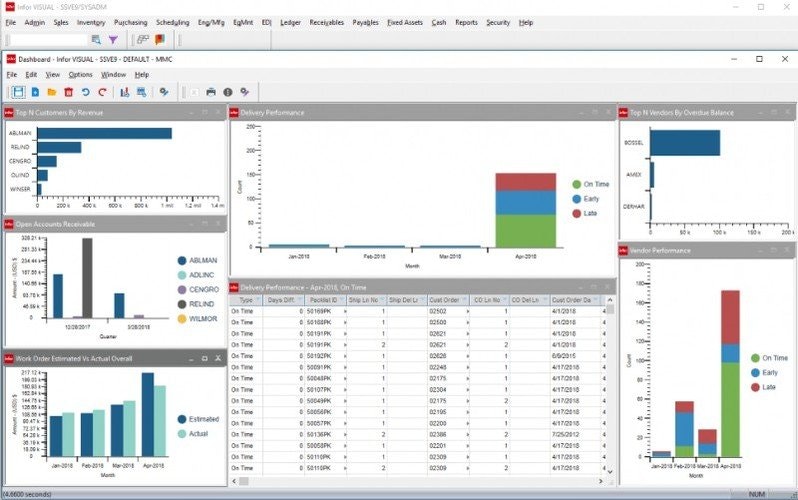 A dashboard from Infor VISUAL ERP includes metrics for delivery, vendor performance, work orders and financial information.
Maybe quality is an ongoing issue: Track your reject rate and look at metrics related to the quality and handling of raw materials to find the source. Perhaps asset capacity isn’t as high as it should be: Watch KPIs for maintenance teams and see if they have a backlog of work orders that could be causing a reduction in machine availability.
RECOMMENDED ACTION: Start implementing data visualization tools now. They’re the starting point for a strategic digital approach to manufacturing excellence that will keep you competitive into the future by making more impactful use of all your valuable data.
Go Beyond Visualization with Mature Analytics
Gartner outlines four stages of analytics, which increase in sophistication and eventually takes the interpretation of data out of your hands. Collecting and visualizing data is the first step to reach higher levels of maturity.
Increasing Maturity of Manufacturing Analytics
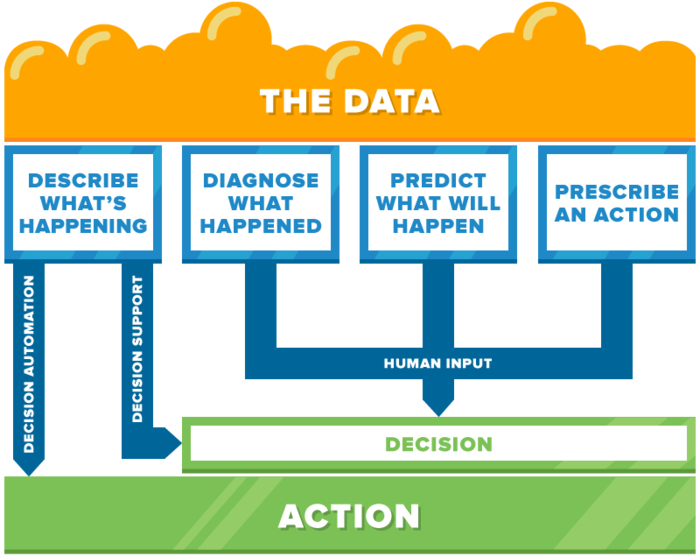
A version of this image originally appeared in “Industrial Analytics Revolutionizes Big Data in the Digital Business” (Content available to Gartner clients)
As you move up the maturity stages, the system offers more insight from the data, from a simple explanation of the cause, all the way to automating actions that prevent a costly failure.
For example, let’s say you suspect your yield rate is lagging from last month. Depending on the level of analytics you employ, software can offer a range of help:
Descriptive analytics tell you what happened. This may be a static report you generate to see the yield rate data visualized.
Diagnostic analytics tell you why it happened. This would likely be a dashboard that looks at past data to determine why production slowed down.
Predictive analytics tell you what will happen. This would come in the form of a forecast that shows users how the yield rate will continue to decrease over time.
Prescriptive analytics tell you how to fix it, either by support to make a decision or through automation to perform the action alone. The system would make recommendations, or take action itself, to reach the optimal production rate again.
As your company grows, create a data maturity plan with management to lay out the path for investments in analytics. Convey the benefits of making manufacturing decisions using real data to get buy-in and upgrade your technology whenever possible.
How Can I Leverage Manufacturing Data?
If you’re convinced you need to begin visualizing data, nearly every product in the manufacturing software space offers dashboards and other reporting methods to present data in various ways.
You can begin by reviewing our top manufacturing systems to evaluate their reporting and analytical capabilities. Or, you can narrow down your options by speaking with our software advisors at (844) 680-2046 who will help you create a short list of systems based on your specific needs
Information on Gartner’s Top Technology Trends for SMBs Survey
1Gartner conducted this survey in April and May 2017 among 699 U.S.-based SMBs, with more than 10 employees and annual revenue of less than $100 million. The survey excluded nonprofit organizations. The qualified respondents are decision-makers, or have significant influence on the decisions related to purchasing technologies for their organization.