Best Construction Categories
Best Facilities Management Categories
Best Human Resources Categories
Best Legal Management Categories
Best Manufacturing Categories
Best Medical Categories
Best Property Management Categories
Get 1-on-1 advice in 15 minutes. It's free.

Josh P.

What Is Data Blending, and Which Tools Make It Easier?
In the past, business analysts could be measured by their ability to coax multiple data sources to play nicely.
Now, the complexity and volume of the data you’re blending often reflect more on the quality of your software than your SQL heroics or status as an Excel jockey.
Of course, knowledge of SQL and advanced skills with Excel will remain crucial in most branches of business analytics for the foreseeable future. With that being said, combining dozens of fact tables in complex queries can be tedious work even for seasoned analysts.
And who wants to spend hours preparing data in Excel when a dedicated tool could do the same work in minutes or even seconds?
Joining data sources in Vero Analytics
We’ve talked in detail with vendors of leading self-service tools for data preparation and demoed the data blending features of their solutions. This report will help you understand how these tools ease the headaches caused by endless join clauses, massive Excel files, unwieldy data sources such as PDFs etc.
Here’s what we’ll cover:
(Click on a link below to jump to that section.)
Data Blending vs. Data Integration
The Two Types of Self-Service Data Preparation Tools
What Are the Benefits of Best-of-Breed Data Preparation Tools?
Benefit #1: In-Database Blending for Improved Query Processing
Benefit #2: Fuzzy Matching for Blending Dirty Data
Benefit #3: Extracting From Difficult Formats
Data Blending vs. Data Integration
Many people use the term “data blending” as a synonym for join clauses in SQL queries. Join clauses combine data from two or more tables by linking them using a common dimension (for instance, a “product ID” or “customer ID” field that serves as a key linking both tables).
This seems easy enough, but the complexity of joins grows exponentially with the number of fact tables you need to query. And hunting for common dimensions across multiple data sources can be challenging, to say the least.
Traditional data integration processes, also known as extract, transform and load (ETL) processes, solved some of these headaches.
In ETL, data is extracted from multiple transactional databases, transformed into a normalized format for analysis and loaded into a data warehouse where business analysts can slice and dice it with OLAP tools.
The problem with this approach is that the IT department, rather than business analysts, is in charge of the ETL process. This setup ensures that ETL is standardized, regularly scheduled and centrally governed, but what happens if an analyst needs to combine data sources in the moment? IT can’t invent, standardize and execute a new ETL process every time an analyst needs to combine data sources.
Matthew Madden, director of product marketing at Alteryx (a major vendor of self-service data preparation and analytics solutions), explains that data blending tools differ from traditional data integration tools in their focus on the ad hoc needs of analysts:

“For us, data blending is about working with multiple sources of data by preparing them and joining them together for a specific use case at a specific time. It’s different from data integration, because data blending is about solving a specific use case, whereas data integration typically gives you a single source of truth and stores it in a data warehouse for people to access.”
Matthew Madden, director of product marketing at Alteryx
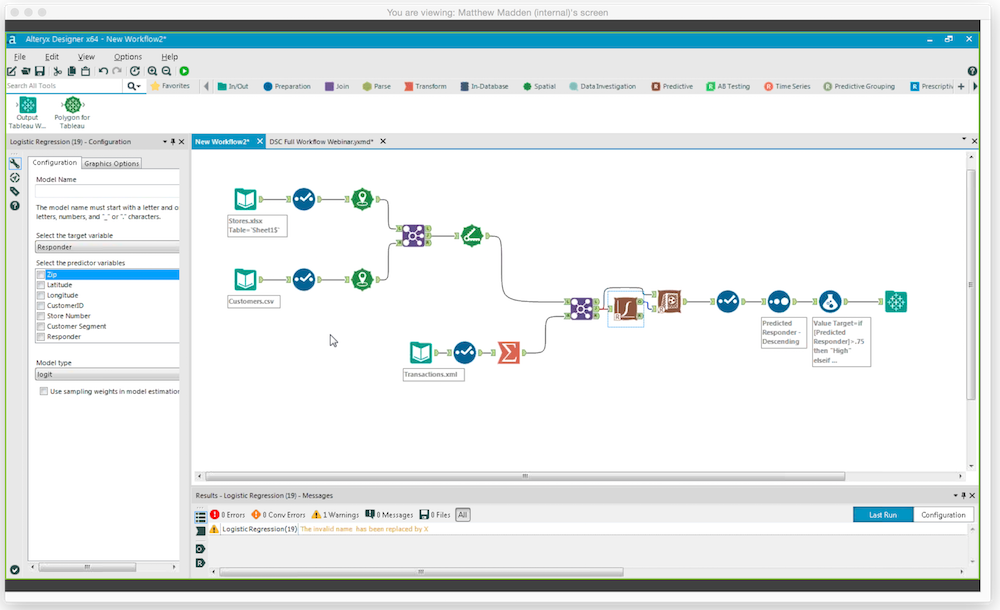
Drag-and-drop data blending in Alteryx Designer
Moreover, Madden notes that self-service tools are “built for the business analyst” rather than an IT user.
It’s important to understand, however, that self-service tools are intended to supplement rather than replace traditional ETL.
Dan Potter, chief marketing officer at Datawatch (another leading player in the self-service data preparation space), observes that “self-service data prep augments what ETL can do, and in many cases, because of our emphasis on data sources like multi-structured content, we’re feeding data warehouses. Moving forward, we see self-service data preparation playing a much larger role in areas where ETL just can’t provide the agility and flexibility.”
Before we look at the features self-service tools offer that help in these areas, we need to look briefly at the types of self-service tools on the market.
The Two Types of Self-Service Data Preparation Tools
Data preparation and blending features are found in two types of self-service tools:
Visual analytics platforms such as Tableau, Qlik Sense, Spotfire etc.
Best-of-breed data preparation platforms such as Datawatch Monarch, Alteryx, Vero Analytics etc.
Visual analytics tools are basically graphical user interfaces for performing analytical operations on data with little to no assistance from IT. Since data analysis always starts with preparation, visual analytics tools also offer a range of data preparation features, including data blending functionality.
Tableau, the leading visual analytics platform, has some powerful blending features such as cross-database joins. Vijay Doshi, director of product management at Tableau, explains that “when related data is stored in tables across different databases, you can use a cross-database join to combine the tables.”
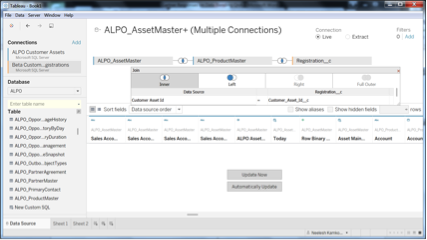
![]()
Multiple connections to SQL Server databases in Tableau
Since databases store data in various formats, finding dimensions to join on can be tricky, but Tableau can help here as well with automated data discovery features.
Doshi notes that “Unlike other technologies, the ability to detect the common field to link on is performed automatically without the need of IT’s help. When it’s not automatically detected, a user can easily edit the relationships in Tableau, based on the knowledge of the data they have.”
In a visual analytics tool, these data preparation and blending features are typically powered by an in-memory engine that leverages the processing power of the computer the tool is installed on or an application server to prepare the data.
These engines are quite powerful, but fall short in certain use cases. Moreover, while Tableau’s data preparation features are advanced, Tableau’s focus is ultimately on visual exploration of data sets, rather than data preparation.
Self-service data preparation tools such as Datawatch Monarch and Alteryx Designer, on the other hand, are dedicated platforms for extracting, preparing and blending data. These tools can be used either to feed prepared data sets into a visual analytics tool such as Tableau, apply advanced analytics to data, or even generate scheduled static reports like those created by traditional, IT-governed systems of record.
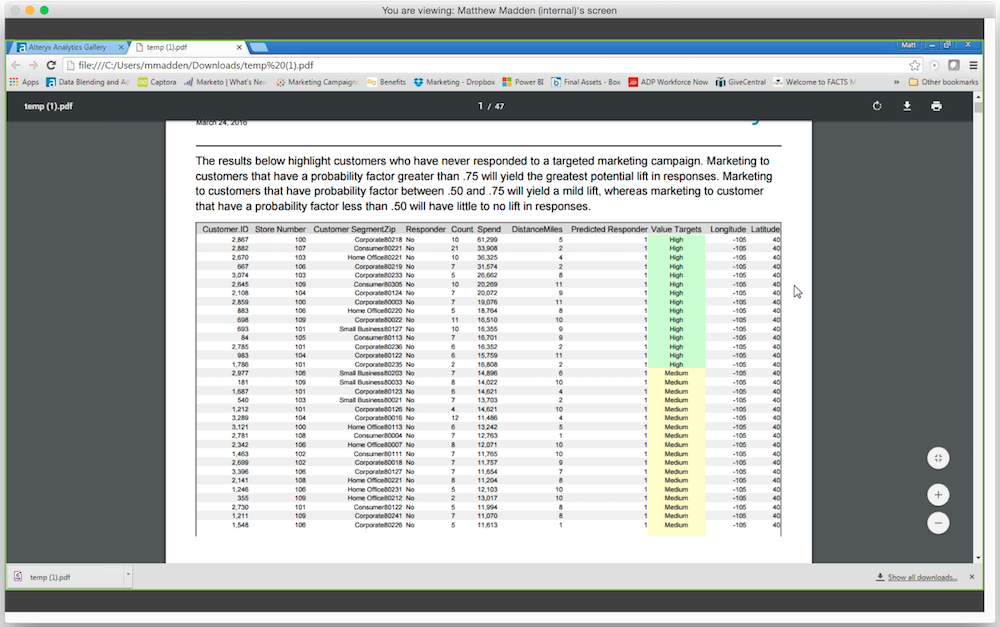
![]()
Static Report generated with Alteryx Designer
Madden notes that “We have over 500 joint customers with Tableau, so we do know that there’s a need for data preparation within the visualization market.” And conversely, there’s also a need for data visualization in the preparation market.
What Are the Benefits of Best-of-Breed Data Preparation Tools?
Many organizations will need both a visual analytics platform and a best-of-breed data preparation solution. Others can get by with just one or the other.
Your choice of tool should be guided by the specific benefits of best-of-breed data preparation tools, which we’ll turn to now.
Benefit #1: In-Database Blending for Improved Query Processing
Some best-of-breed data preparation tools enable you to blend data inside your database itself, as opposed to leveraging the power of your laptop or an application server to do the blending. This capability relies on an engine inside the tool that’s capable of generating multipass SQL queries, i.e., multiple queries, the results of which are aggregated into a unified set.
As Ajo Abraham, CEO and founder of data preparation startup Vero Analytics explains, “you have to take a query request from the user, digest it into smaller chunks, aggregate the data at the level required and then mash it all together so the user gets an accurate result.”
The reason this capability is important, Abraham continues, is that it vastly expands how much data you can process. “Let’s say you have a 10,000 row .CSV file containing customer IDs, and you want to cross-reference those customer IDs with your customer database, which has about 100,000,000 records. There’s no way to do this within the engine of a BI tool installed on your desktop—you’d have to ask the ETL guys to do this for you.”
With a self-service tool, however, you can DIY this blend. Abraham notes that tools such as Vero utilize your database “infrastructure to do the job, because it’s built for joining massive sets.”
As you can see in the example Abraham gives, even Excel files can pose tough blending issues. Madden observes that “the source of data doesn’t matter—it can be an Excel file. In many cases, people working with multiple tabs of data in Excel use Alteryx instead of VLOOKUPs.”
Thus whether you’re blending within an Excel file or blending an Excel file within your database, best-of-breed data preparation tools can speed up and simplify the work.
Benefit #2: Fuzzy Matching for Blending Dirty Data
“Fuzzy matching” is an advanced analytics capability that automatically detects approximate matches between values rather than perfect matches. It’s a relatively rare feature that’s primarily found in best-of-breed data preparation tools.
Carlos Oro, director of product management for data preparation at Datawatch, explains that “in many cases, there are data quality problems when mixing two data sources, so we have fuzzy matching included in the solution to expand the results set.”
The problem with fuzzy matches is that approximate matches aren’t always actual matches, but Datawatch helps you sort good matches from bad by scoring the probability that the fuzzy match is a real match.
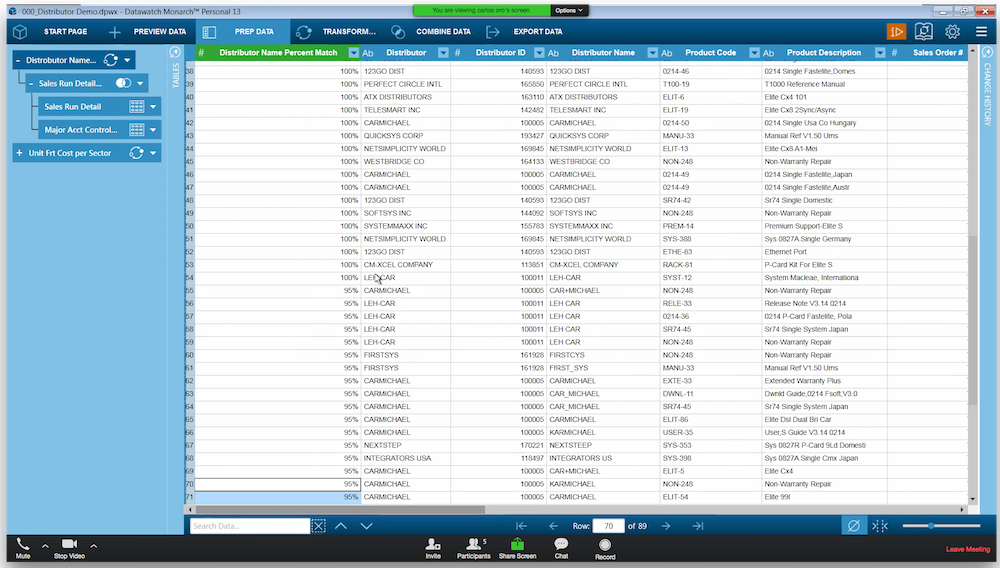
Fuzzy match scoring in Datawatch Monarch
Oro continues: “Once I’ve done the join, a score indicates how much of the information I’ve blended is matching perfectly and how much may not be matching precisely. You can then decide which matches you want to accept.”
Benefit #3: Extracting From Difficult Formats
One major use case for self-service blending and indeed, best-of-breed data preparation tools in general, is to analyze data contained in wonky formats such as PDF reports and web pages.
With a solution such as Datawatch Monarch, you can scrape a web page and convert the data it contains into an easy-to-analyze table in a matter of seconds.
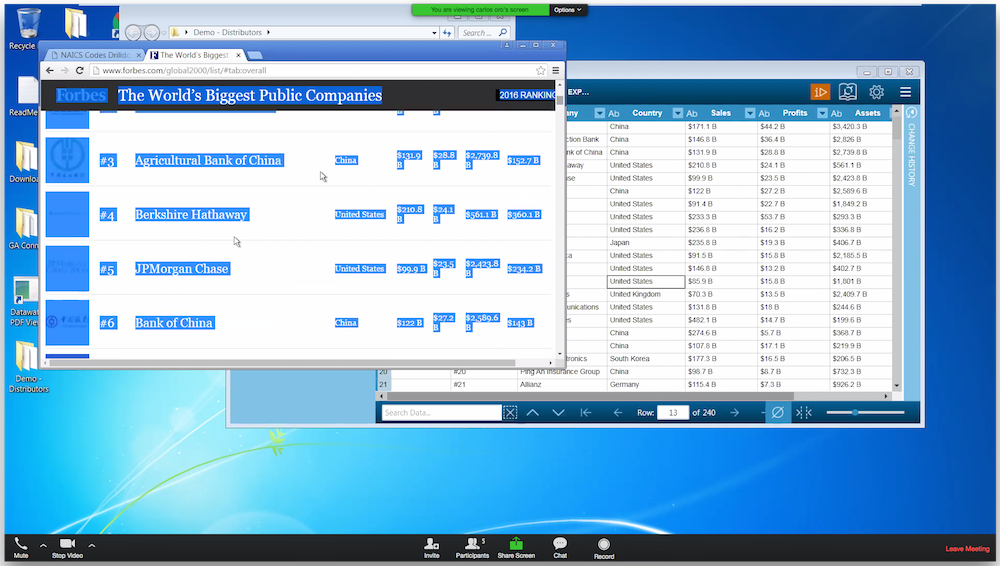
Web-scraping functionality in Monarch
Self-service data preparation tools can also work with even thornier formats such as PDF reports. Datawatch’s Potter explains an intriguing use case for this feature:
“Time Warner Cable relies on a third party to do their billing, so every time you do a pay-per-view transaction or another transaction it’s captured by the third party. Every two weeks, this billing company provides a report of all the transactions to Time Warner in the shape of a .PDF file that runs to 170,000 pages. They used to have a team of accounts to manually cut, copy and paste this report before they stumbled on Monarch.
Today, they’ve moved everything onto a server, such that when the report becomes available, the Monarch Server listens for the new data, automatically runs the data extraction/preparation routine and pumps it into their data warehouse. I don’t know of a single ETL vendor that can do auto-parsing of a complex report like that.”
Even at smaller organizations, .PDFs and web pages are incredibly common data sources, and best-of-breed tools make working with them much easier.
Next Steps
Now that you’ve begun to understand the use cases for best-of-breed data preparation solutions as well as data blending features in visual analytics platforms, here are some next steps you can take in order to pick the right tool for your needs:
If you’d like to learn more about self-service data preparation, you can read our data preparation guidebook.
If you’d like to learn about alternatives to traditional data integration strategies beyond self-service data preparation tools, take a look at our report on data warehouse alternatives.
If you’re starting to think a visual analytics tool like Tableau will work for your needs, we offer an overview of Tableau’s product line.
If you’d like to examine more options as well as read reviews, reference our listing of self-service BI solutions.
If you’re still having trouble finding vendors that will work for your needs, call (855) 998-8505 for a free consultation with one of our software advisors. We can assess your industry vertical, feature needs and budget to recommend a short list of vendors that will work for you.