Find Your Perfect Financial Dashboard: Four Essential Types to Know
Not everyone is wired to love numbers. Crunching numbers from a balance sheet or a profit and loss statement can often be overwhelming, especially for non-finance professionals.
Whether you are a small business owner or a business unit head, numbers from financial statements are crucial to track business performance and improve productivity. Dashboards take the edge off complex financial reports transforming the data into easy-to-understand visuals for you.
If you thought dashboards are only for large businesses, it’s simply not true—all you need is the right tool. With the help of Gartner research [1] and our conversation with Eric Bramlett [2], a seasoned entrepreneur and owner of a Texas-based real estate company, we demystify the use of financial dashboards for small businesses and outline four of the types you need to know about.
What is a financial dashboard?
A dashboard is a highly visual display that aggregates the most important information about your business objectives from various sources and represents them in charts, dials, and gauge-like formats on a screen. The idea of a dashboard is to get the information you need at just a glance.
Financial dashboards tell a visual story about a business’s performance with financial key performance indicators (KPIs), such as profit margins (how much profit a product or region earns for you), inventory levels (how much stuff you have for resale), and accounts receivable levels (how much money customers owe you). For Eric [2], a financial dashboard “quantifies intuition.”
Eric Bramlett
Business owner and realtor, Bramlett Residential Real Estate
Why do you need a financial dashboard?
You may not realize it but a business’s financial performance suffers without a dashboard. When you don’t have an easy way to see what’s happening in your business, you ignore problem areas and don’t react in time. According to Eric [2], here are five reasons you need a dashboard.
Spot hidden trends: Discover profitable opportunities and areas for cost-cutting that may have gone unnoticed.
Make data digestible: Present complex financial data in bite-sized, visually appealing formats that anyone can understand, facilitating communication with employees from non-finance backgrounds and executives.
Track business goals: Keep an eye on your progress, and make timely course corrections to maintain your business’s financial health. Dashboards make it simpler for managers to track actual vs. planned expenses in department-level budgets.
Create a leaderboard: Foster collaboration and healthy team competition, keeping everyone aligned and motivated to perform better. Management at Bramlett Residential Real Estate [2] uses their dashboard to introduce friendly competition among field agents.
Stay up to date: Access real-time information to adapt swiftly to changes within the organization or market and gain a competitive edge.
Choose from four types of financial dashboards
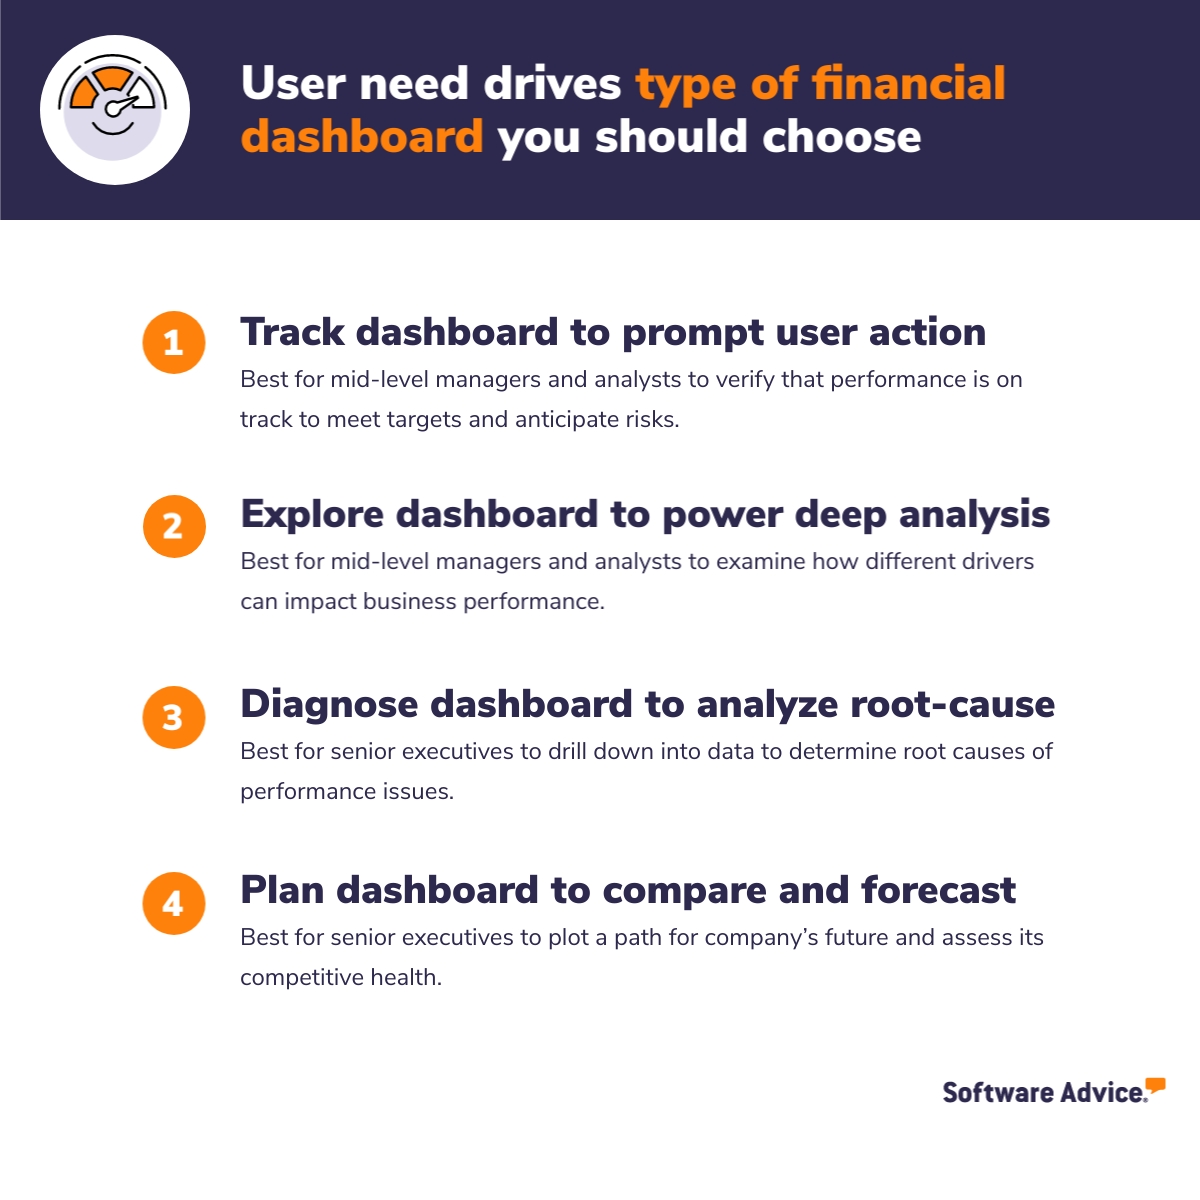
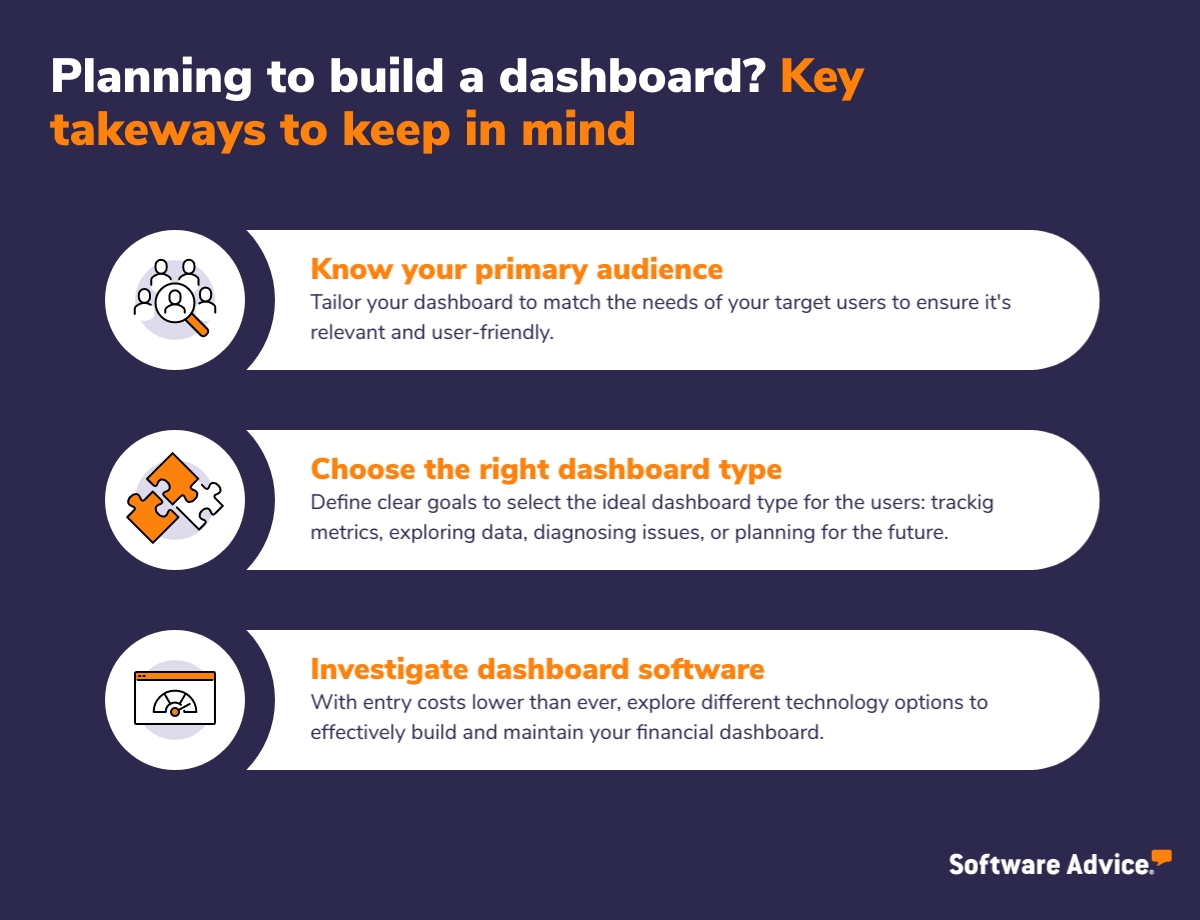
A dashboard loses its utility when there’s too much information of little relevance for the user. Choose your dashboard by considering who will use it and what decisions the user will need to make. Based on these two parameters, Gartner [1] identifies four distinct types of financial dashboards you can build.

Type 1. Tracking dashboards for mid-level managers to prompt action
Tracking dashboards provide real-time insights into the most critical financial metrics that impact your day-to-day operations and short-term performance goals. They are designed to enable swift action and allow users to promptly address any urgent issues that may arise.
Who uses financial tracking dashboards?
The audience for tracking dashboards includes departmental heads, managers, team leads, analysts, and supervisors, responsible for smooth operations and meeting targets.
Example 1: Cash flow valuation dashboard
This is a cash flow valuation dashboard that gives an investor visibility into the company's cash flow by showing total investments made and their returns. The metrics on this finance dashboard require little contextualization for the user and can help them efficiently track the performance of funds.

Cash flow valuation financial dashboard example [1]
Example 2: Budget dashboard
This is a budget dashboard that shows variations from the original plan by stacking budgeted versus actual operating expenses. It enables users to identify areas of overspending or underspending at a glance.

Budget financial dashboard example [1]
Pro tips
Highlight select key metrics: Focus on a few critical metrics that matter most to the target user.
Group actuals and projections: Clearly communicate whether your business area is performing better or worse than expected.
Set auto-alerts: Prompt users to act by sending alerts when a financial KPI falls out of the expected ranges.
Type 2. Exploratory dashboards for mid-level managers to conduct deep analysis
These are usually that let you dive deeper into the data to gain an in-depth understanding of underlying trends and discover more patterns. Exploratory dashboards help users examine how different drivers impact a given metric; for example, the impact of several regions or seasons on the profit of a company.
Who uses exploratory financial dashboards?
The audience for these dashboards includes business analysts and departmental heads looking to get fresh insight into business outcomes.
Example 3: Profit analysis dashboard
This is a profit margin dashboard that facilitates drill-downs into a data source—in this case, to a product subcategory.

Profit and loss dashboard example (Source)
Pro tips
Provide access to the data source: Enable users to access all relevant data for a particular data point to tap into additional insights.
Show data definition: Avoid confusion and enhance data transparency by using pop-ups, tooltips, or providing links to data catalogs.
Make components adjustable: Allow users to customize their dashboards by moving components around and including or excluding data.
Type 3. Diagnostic dashboards for senior professionals to analyze root causes
Diagnostic dashboards are for users looking to determine the root causes of performance issues. With in-depth visualizations, they help users unpack complex trends and stack factors impacting the business against each other to explore correlations. Users of these dashboards usually further investigate the data using .
Who uses diagnostic financial dashboards?
The audience for these dashboards includes high-level decision-makers such as senior executives, directors, and business owners.
Example 4: Sales dashboard
This is a sales dashboard showing total sales from social media. It breaks down the contributing drivers and provides additional context.

Sales financial dashboard example [1]
Example 5: Revenue dashboard
This is a revenue dashboard giving visibility into the income earned. Plus, it can be customized to accommodate more information about revenue, such as units sold and the age range of buyers. Users can add, remove, or move metrics based on their preferences by using the yellow button located at the top.

Revenue dashboard example [1]
Pro tips
Explain contributing drivers: Ensure the dashboard explains factors that influence a specific metric; for example contributing drivers for sales revenue could include promotional activities, website traffic, and direct sales calls.
Provide drag-and-drop customization ability: Allow partial customization of the dashboard via drag-and-drop functionality and the addition of new metrics.
Type 4. Planning dashboards for seniormost professionals to compare and forecast
Planning dashboards help users compare data with previous years’ or competitors’ and build forecasts to devise strategic plans. These dashboards help plot a path for a company's future and assess its competitive financial health.
Who uses planning financial dashboards?
The primary audience for these dashboards is business owners, chief financial officers, planning teams, and other professionals in top leadership.
Example 6: Demand forecasting dashboard
This is a demand forecasting dashboard that makes it clear what the demand for the future looks like based on previous years’ trends and the current variance between actual and anticipated demand.

Forecasting financial dashboard example (Source)
Example 7: Market overview dashboard
This is a market overview dashboard that delivers a concise yet highly informative summary for executives in the air travel industry. One interesting part of this dashboard is that it provides a quick, easy-to-understand text summary about the industry and market position, sandwiched in between eye-catching visualizations.

Market overview dashboard example [1]
Example 8: Sales performance dashboard
This is a sales performance dashboard that captures the comparative success of tech companies and provides fields on the right that can be easily adjusted to generate visualizations according to the user's needs.

Sales comparison dashboard example [1]
Pro tips
Keep the language simple and natural: Avoid abbreviations, jargon, or specialized terms in your text or dashboard labels.
Offer simple adjustment options: Make it easy for users to explore different outcomes of their planning decisions. Try including adjustable variables and preset scenario choices that produce different results.
Irrespective of the type of financial dashboard you choose, you may encounter some basic challenges. Here’s a quick overview of that and some solutions to overcome them.
Common challenges in building a financial dashboard
Eric Bramlett [2]
Challenge #1: Integrating data from various sources
Your dashboard is only as good as the data it’s built on. Integrating data from disparate sources is a primary challenge in building a dashboard. It often leads to incompatibility issues and data discrepancies such as incomplete information.
What can you do? |
|---|
Invest in cloud-based systems that offer centralized data management and make it easy to aggregate data from various sources. |
Challenge #2: Routinely updating information
Dashboards are always time-sensitive. If you’re going to use this data to make informed decisions, it must be most current. So, you must collect data regularly, validate its correctness, and update it on the dashboard in time. This poses a considerable challenge for small businesses with limited resources.
What can you do? |
|---|
Try dashboard software or business intelligence tools equipped with data connectors and scheduling capabilities that ensure real-time data updates. |
Challenge #3: Selecting relevant metrics
Eric’s dashboard tracks just three main metrics: top-line sales, gross profit margin, and agents’ commissions [2]. Making sure you include the most relevant financial metrics is critical to ensure the usability of a dashboard, which can be a daunting task if you don’t know your users and industry dynamics.
What can you do? |
|---|
Work with your primary users to understand their needs, knowledge levels, and objectives. Involve end-users in the dashboard design process and conduct a test run before finalization. |
Challenge #4: Collaborating with multiple stakeholders
Getting multiple teams onboard, aligning their diverse needs, and managing communication can be a significant challenge in creating a dashboard.
What can you do? |
|---|
Use effective collaboration strategies, such as a kick-off meeting and shared project management tools to define shared goals, expectations, and responsibilities of teams involved in creating and utilizing the dashboard, such as finance, IT, and other end-users. |

If you’re still overwhelmed about building a financial dashboard, take Eric’s [2] advice: “Don’t miss the good in the search for perfection. Launch version one of your financial dashboard as soon as you can. Then, simply evolve your dashboard as your needs change.”
Starting is easy—check out top dashboard software options that offer preset templates, ready for you to customize for your specific needs.