What Is Cohort Analysis?
A “cohort” is simply a group of people who are similar in some way.
Etymologically, the word “cohort” was originally applied to a Roman military unit:

These gentlemen have something in common… (Roman soldiers by Matthias Kabel is licensed under CC BY 3.0)
While there are probably some unfortunate marketing departments churning out content about military history, this sense of the word “cohort” is pretty much obsolete.
Business analysts, data scientists and market researchers have repurposed the word “cohort” by applying it to any group (such as product groupings)—not just groups of people.
As we’ll see, this is because the statistical methods used to analyze groups of people can also be applied to other kinds of classification problems.
We’ll explore the kinds of cohorts that business analysts and marketing departments need to focus on, as well as the methods and business intelligence (BI) tools used in cohort analysis.
Here’s what we’ll cover:
The Two Types of Cohorts
Cohort analysis basically involves grouping people (typically customers and/or users) using data.
Gartner digital commerce analyst Jennifer Polk offers a comprehensive definition in Grow Custer Lifetime Value With Digital Commerce (full content available to Gartner clients):
“Cohort analysis groups customers by a common characteristic observed in a given time frame, studies their behavior as a group over time and compares behavior across multiple groups.”
All this talk of customers, groups and segments may leave you wondering what kinds of groups you’re actually supposed to create during cohort analysis.
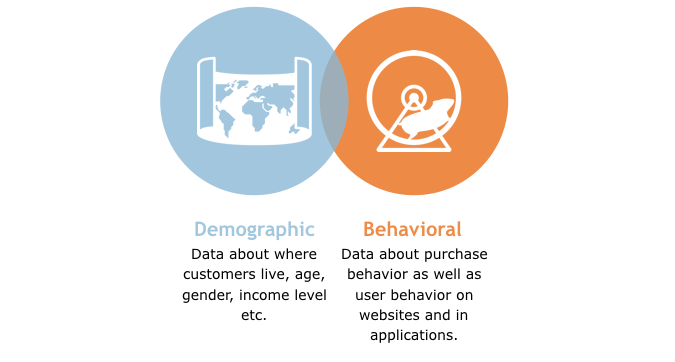
The answer is that it depends on your data, but typically, marketers and business analysts use two kinds of data in cohort analysis:

Let’s now take a closer look at each type of cohort analysis. Keep in mind that frequently, marketers and business analysts combine both kinds of data (for example, website users with North American IP addresses).
Demographic Cohorts
Demographic data includes dimensions like age, gender, household income, martial status, ethnicity etc. Marketers have long used demographic data to better target campaigns, typically by grouping various demographic dimensions into _segments—_e.g., single mothers living in Connecticut and making in excess of $75,000 annually.
See our guide to customer segmentation analysis for more on this subject.
Behavioral Cohorts
The major complexities of cohort analysis involve factoring in customer behavior. A classic example is first-time vs. repeat customers. Another well-known behavioral metric is churn rate, i.e. the rate at which customers quit purchasing or using a product/service.
Typically, marketers and business analysts focus on behavior across digital channels, primarily:
E-commerce platforms
Mobile apps
Company websites
Social media
Software applications aimed at end users—games, business applications etc.
Internet of Things (IoT) devices
Device type is a particularly important dimension in analyzing digital behavior. Visitors to a web site can still have substantially different experiences based on whether they’re viewing the site on a laptop or a smartphone.
Examples of behavioral cohorts:
Customers who put an item worth more than $50 in a shopping cart, continue browsing for another 30 minutes and then remove the item from the cart.
A group of customers who download a company’s app and use it for a week before uninstalling it.
In the context of web analytics, bounce rate is a well-known behavioral metric.
The Uses of Cohort Analysis
Cohort analysis isn’t an intellectual exercise but a part of daily operations at many digital businesses. Indeed, we’ll see that cohort analysis isn’t just carried out by analysts, but automatically by machine-learning algorithms.
Before getting into advanced considerations, however, it’s important to establish the basic use cases for cohort analysis:
E-commerce analytics
For a physical store or restaurant, it’s only marginally useful to know whether customers took the freeway or surface streets to get to the location.
For an e-commerce retailer, however, knowing where your traffic is coming from is a matter of life or death.
This is why Polk recommends in How to Build a Digital Commerce Marketing Strategy that e-commerce retailers “analyze sales and customer data to determine how much revenue is coming from which digital channels.”
After such an analysis, you can decide to focus on certain channels with promotional offers, targeted advertising etc.
Additionally, Polk observes that “fixing issues on your e-commerce site or application can improve digital commerce conversion and transaction frequency.”
UX optimization/web analytics
This brings us to UX optimization for websites and mobile apps, one of the most important use cases for cohort analysis.
One of the key ways to group your customers into cohorts is to focus on the “device” dimension.
For instance, say that an analyst notices a higher-than-average cart abandonment rate on an e-commerce site. When the analyst segments customers by device type, she realizes that the higher-than-average cart abandonment rate is limited to mobile users. This insight leads to the detection of navigation issues with the checkout process caused by how the site displays on mobile devices.
If you have demographic data in your CRM system, you can also investigate how different demographic cohorts navigate your site.
For instance, detection of a higher-than-average bounce rate among millennials could be an indication that your site’s design is off-putting to younger visitors.
Targeted advertising
Another central use case for cohort analysis is improving user experience (UX) on websites and in applications.
We’ve already seen how this works in the context of site navigation. You can also tailor UX to your customers by slotting them into cohorts.
For instance, say that PPC visitors from LinkedIn have a higher average income and contribute more revenue than visitors from Facebook. According to the CRM, they also have more senior job titles than Facebook visitors, and have a median age of 51, whereas visitors from Facebook have a median age of 27.
Using this data, you may decide to build a PPC advertising campaign using stock photos of older executives to target this high-value group, and only display these ads on LinkedIn.
Cohort Analysis Tools
Depending on the kind of BI tool you’re using, cohort analysis is either a manual process performed by an analyst or an automatic classification process performed by algorithms. We’ll look at tools for cohort analysis in order of increasing sophistication.
Pivot tables
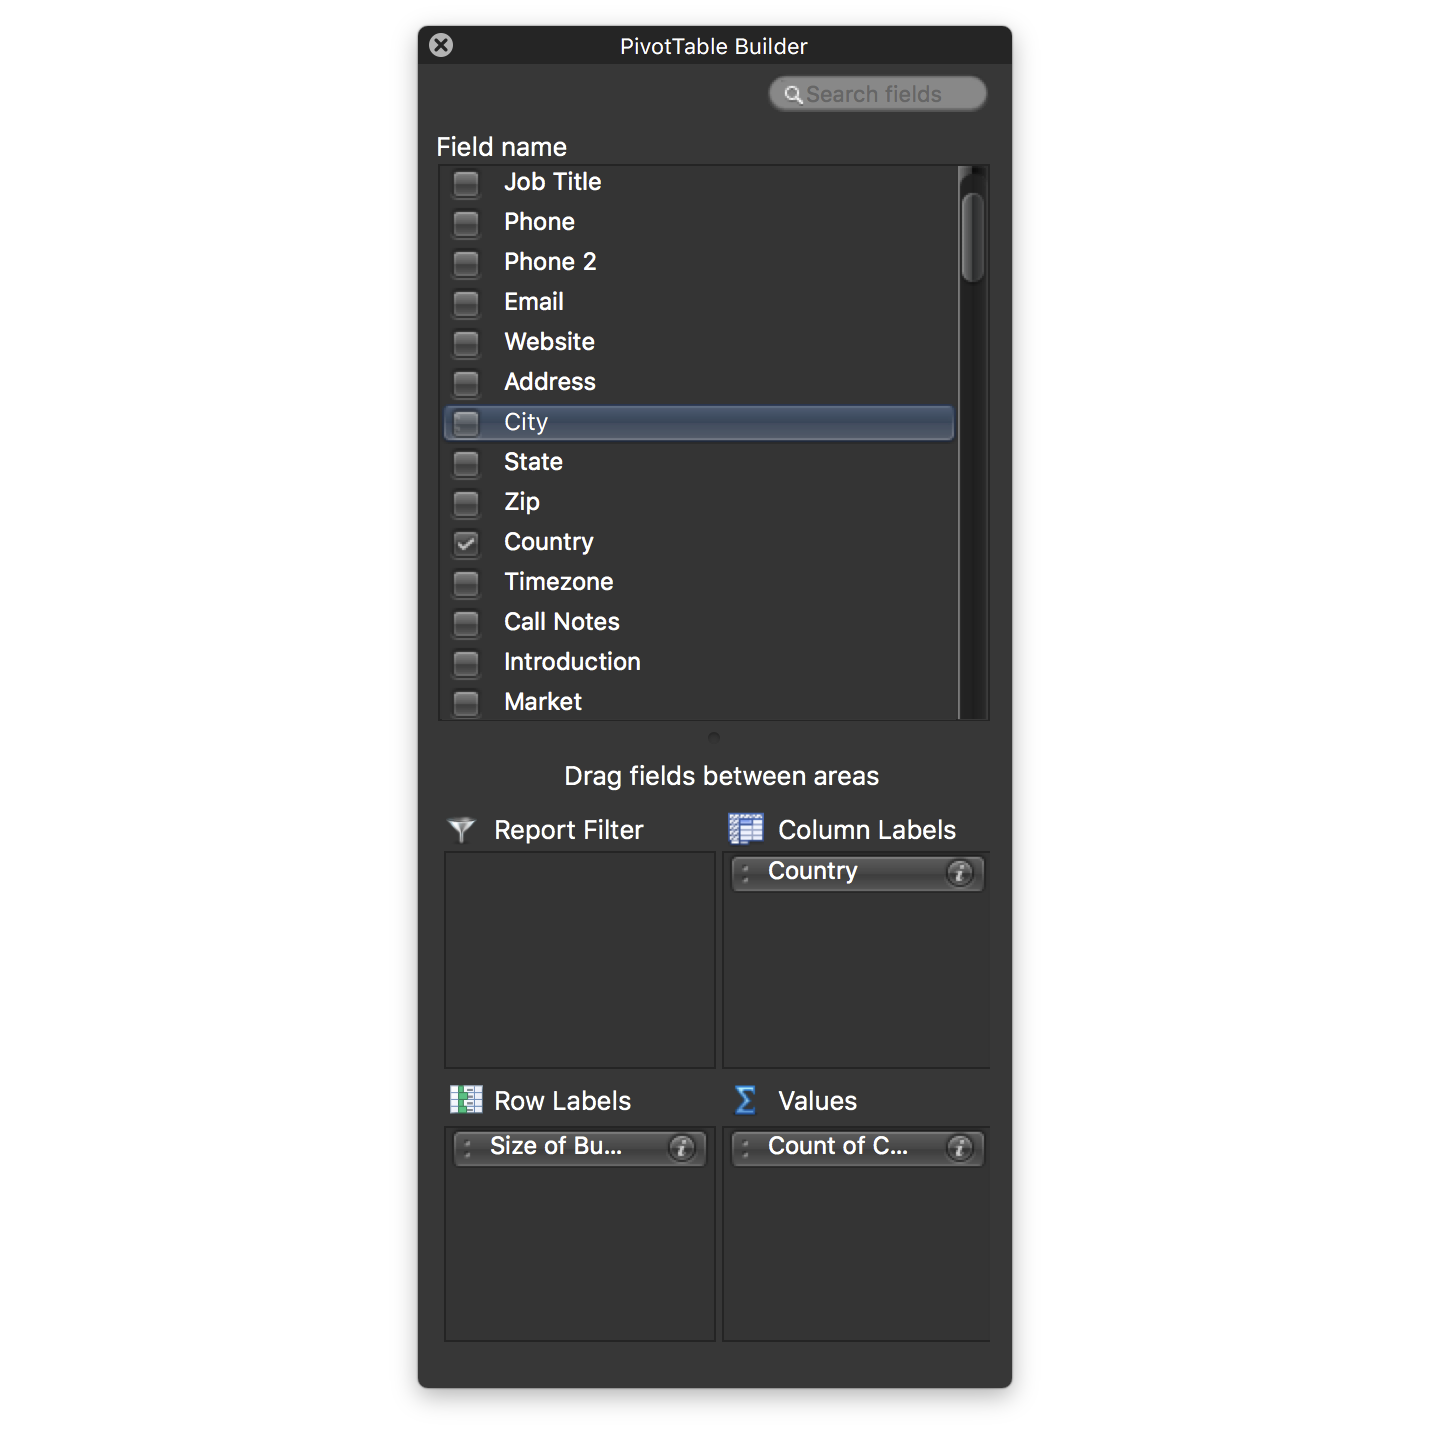
A cohort, as we’ve seen, is a group of dimensions in your customer data. The most basic kinds of cohort analysis are executed by human beings using basic tools for multidimensional analysis, such as pivot tables in Microsoft Excel.
Pivot tables allow you to quickly group dimensions in customer data. You can build cohorts in less than a minute:

Selecting Demographic Dimensions in CRM Data with Excel’s PivotTable Builder(Used with permission from Microsoft)
Visual analytics tools
A category of BI software known as visual analytics tools allow for more advanced cohort analysis, since you can visualize certain dimensions of your customer data while building cohorts.
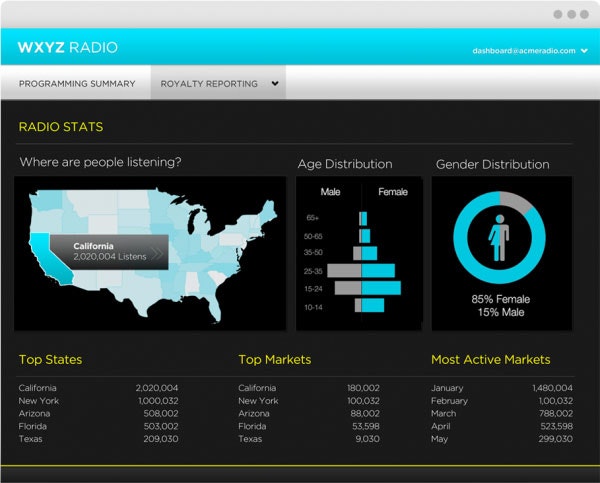
For instance, say you have geographic dimensions (like city, state and time zone in the above example). These can be plotted on a map with a BI tool and combined with other dimensions to create geographic cohorts, as in this visualization of radio listeners by state:

Visualization of Geographic Cohorts in GoodData
With a visual analytics tool, such visualizations can be created simply by dragging and dropping dimensions from a menu, just like the PivotTable Builder in Excel.
SUGGESTED SOFTWARE: Tableau, Qlik, Sisense, Microsoft Power BI, TIBCO Spotfire
Data mining tools
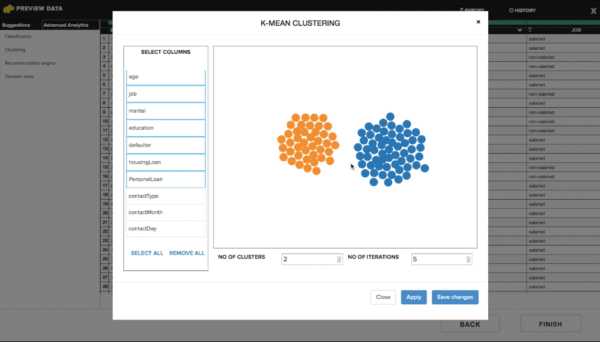
BI tools with data mining capabilities are the most sophisticated options for cohort analysis out there. These tools enable a partially automated approach to developing cohorts known as clustering.
Clustering refers to the use of statistical algorithms to automatically generate classifications.
Thus, instead of the analyst selecting the dimensions she wants from a menu, in clustering, the analyst simply selects how many cohorts she wants. The algorithms then sift through the data to find the best dimensions for grouping the data into this number of cohorts.
In other words, with clustering, the algorithm tells you which dimensions in your data are important.

Cluster analysis in Ideata
Cluster analysis sounds complex because it is complex. We’ve written a detailed guide on the subject for readers who need to know more.
It’s important to note that not all BI tools support clustering. If you’re interested in this approach to cohort analysis, look for products that offer strong support for statistical modeling.
SUGGESTED SOFTWARE: IBM SPSS, SAS/STAT, RapidMiner, KNIME, Alteryx
Need help narrowing down your BI software options? Give us a call at (844) 689-4876 for a free phone consultation.