Your Project Status Report Checklist: What to Include When You Report to Stakeholders
Lists are important. They help us prioritize—and remember to complete—important tasks.
Have you ever gone to the grocery store specifically for one thing, then left with a cart full of everything but? If you leave your grocery list at home, you’re at the mercy of our fallible human memory.
As a project manager, you need to create regular project status reports to update stakeholders on project progress. And just like at the grocery store, no matter how often you create a project status report, there’s a chance you’ll forget something if you don’t have a list.
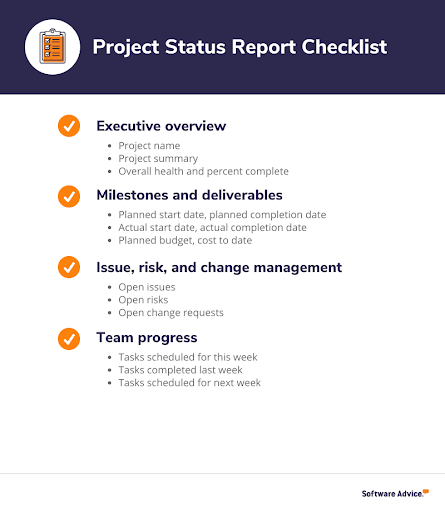
To ensure that your weekly status updates contain the essential information your stakeholders need, we’ve created a simple checklist you can use as a status report template:

We’ll look at each section in more detail and explain what information you should include and how you should structure your project report. We’ll also explore how project tracking software can help you create your project status reports.
Executive overview
PRO TIP: Put the most important information at the top of the project report.
Why? Because your key stakeholders probably won’t read the whole thing. This way, the stakeholders who read the executive overview and skim the rest will have a summary of the most important information.
The first section in your project status report template is the executive overview. It should include a high-level overview of the project status, broken down into three parts:
1. Project identifiers.
Project name
Project ID/code
Name of project manager
Date of project report
It may seem obvious to reference the project name and other items, but without having them on your list, they can be easy to overlook. With the exception of the status report date, the project identifiers will stay the same week-to-week.
Including the date of the status report is very important: This helps establish an accurate project timeline.
2. Progress summary. This section should include a high-level review of overall project goals and the progress made toward them so far. Is the project on track, behind, or ahead of schedule? Is it over or under budget? The progress summary should highlight any items that need project team attention—even if those items are also discussed in a later section of the status report.
3. Overall project health and percent complete. This section should indicate the health (or project status) of various project items:

Project health can be shown visually rather than in narrative form, using a predetermined color code to represent the status of each item (as shown above). For example:
Green means the item is on track.
Yellow means it is in trouble.
Red means it requires immediate attention (and, most likely, stakeholder intervention).
We recommend establishing a quantitative measure for color-coded statuses to best present accurate information. Without this, one stakeholder could misunderstand a yellow status by either overreacting or under-reacting and thus setting the project’s progress back even further.
PROJECT HEALTH STATUS IN ACTION
Set yellow for budget to represent that the project is over the approved allocation by five to 15%. If the budget projections are greater than a 15% overage, the status would be red.
Percent complete should be entered as an actual percentage showing the overall project completion level (e.g., 50 percent for a project that’s halfway done).
How project tracking software can help: Dashboards offer a live display of project team performance and overall status. These tools automatically capture data and organize it in one place, which saves managers time and effort. In cloud-based project tracking systems, dashboards update in real time as progress is made—meaning users always have the current status.

Project overview in Clarizen (Source)
This project overview screen includes several items that should be included in your executive summary: colored icons to represent the status of important items, the name of the active project manager, and the project’s percent complete.
Milestones and deliverables
PRO TIP: Use data visualization tools.
A picture is worth a thousand words, so use visuals whenever possible. You can use colors to represent status or include a percent complete chart, a Gantt chart, or a table showing progress against milestones and deliverables.
The second section in your report should detail the progress made toward significant milestones and deliverables (identified during project planning).
Milestones are often tied to the completion of a client deliverable as well as to mid-project billing and invoicing—so it’s important for stakeholders to know whether teams are on track to complete them.
Rather than writing out this information in narrative form, show your team’s progress with a simple table (see the screenshot below). Be sure to include:
Project milestone percent complete: How much headway has been made on individual tasks leading up to the milestone? Outline which tasks have been completed and which ones are still outstanding.
Planned start/finish: These are the initial dates set during project planning for the work leading up to, and including, this milestone.
Actual start/finish: This is the actual date the milestone was started and completed (if still in progress, mark “finish date” as TBD).
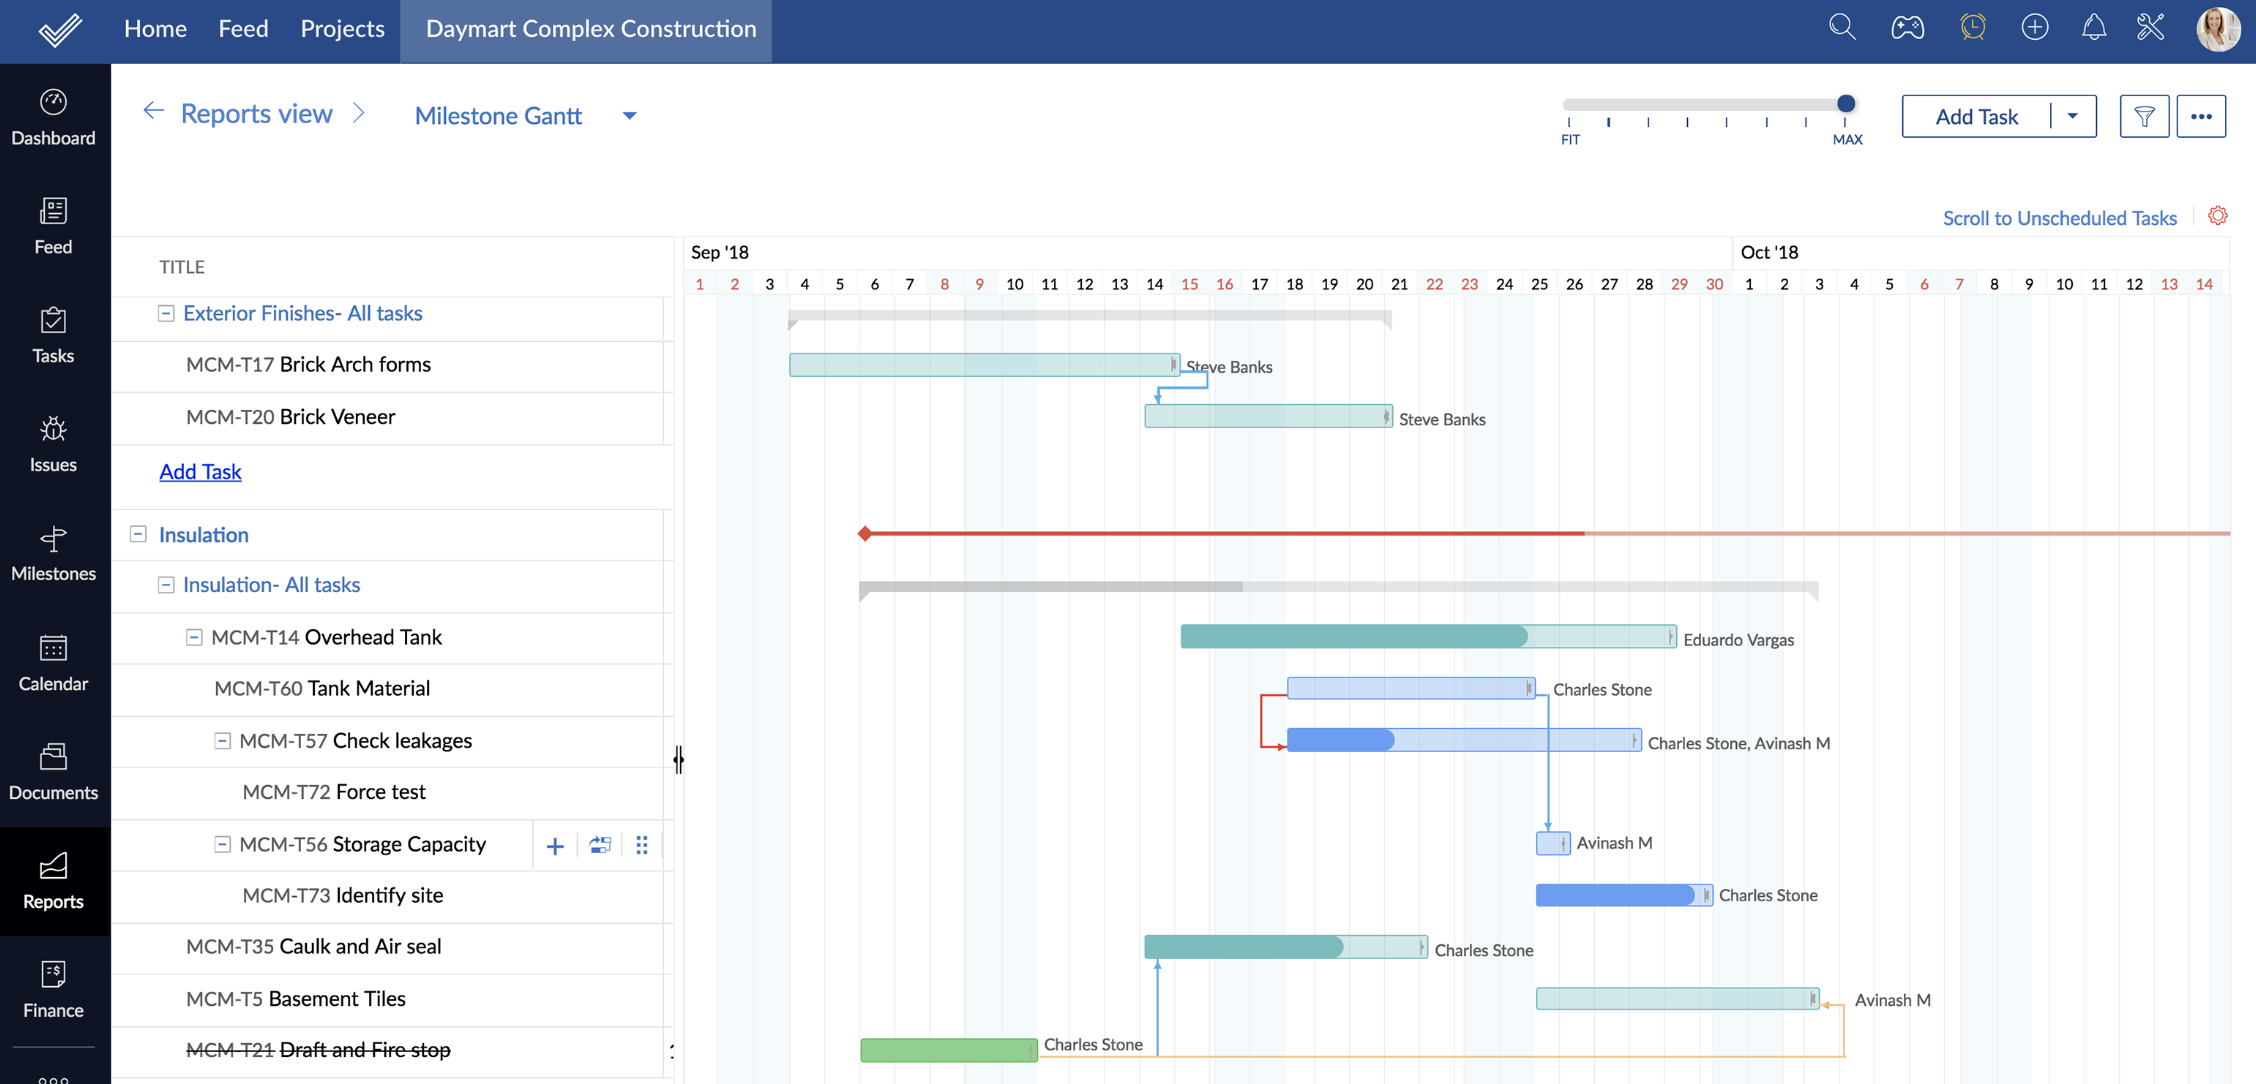
How project tracking software can help: Gantt charts are key project planning tools that double as project tracking tools. Using Gantt charts, you can visualize the project schedule, determine project phases, and highlight key milestones—then track team performance and progress toward achieving them. Some systems have the added benefit of allowing users to drill down into task details from the chart itself.

A Gantt chart in Zoho Projects (Source)
The task details shown above include a “percent complete” icon, the name of the team member responsible for completing the task, and the dates surrounding the task kick-off and completion. The ability to drill down into this information can be very useful when creating your project status reports.
Issue, risk, and change management
PRO TIP: Consistency is key.
Use the same project status report template week to week, since this allows for easier cross-report comparisons. Using a consistent format is important for your report as a whole, but especially for this section—it will allow stakeholders to see, at a glance, any new issues and risks, and quickly spot what has changed about known issues and risks.
The third section in your report should provide an update on any known issues, risks, or change requests that were identified the previous week, and bring to light any new ones.
Early risk detection and management is essential for successfully completing a project. This section of your status report should be bulleted. It must cover all risk management efforts, including:
Open issues: Draw attention to any new project issues since the last report. Additionally, provide a status update on any previously identified issues and their management strategies.
Open risks: Acknowledge any new risks that have occurred since the last report, and present the management plan(s) to deal with them. Additionally, provide an update on the risk management plan being used to handle existing risks.
Open change requests: Highlight any open change requests and next steps that need stakeholders’ attention—for example, extending the schedule or budget due to an increase in the project’s requirements.
How project tracking software can help: Both reports and dashboards can be helpful here. Reports provide a static readout of key metrics such as a project’s ROI, resource utilization and availability, and open issues/risks. Dashboards can be configured with a live display of the same information—in fact, users often have the option of creating a project status report from the dashboard by exporting it or sharing it with other users.

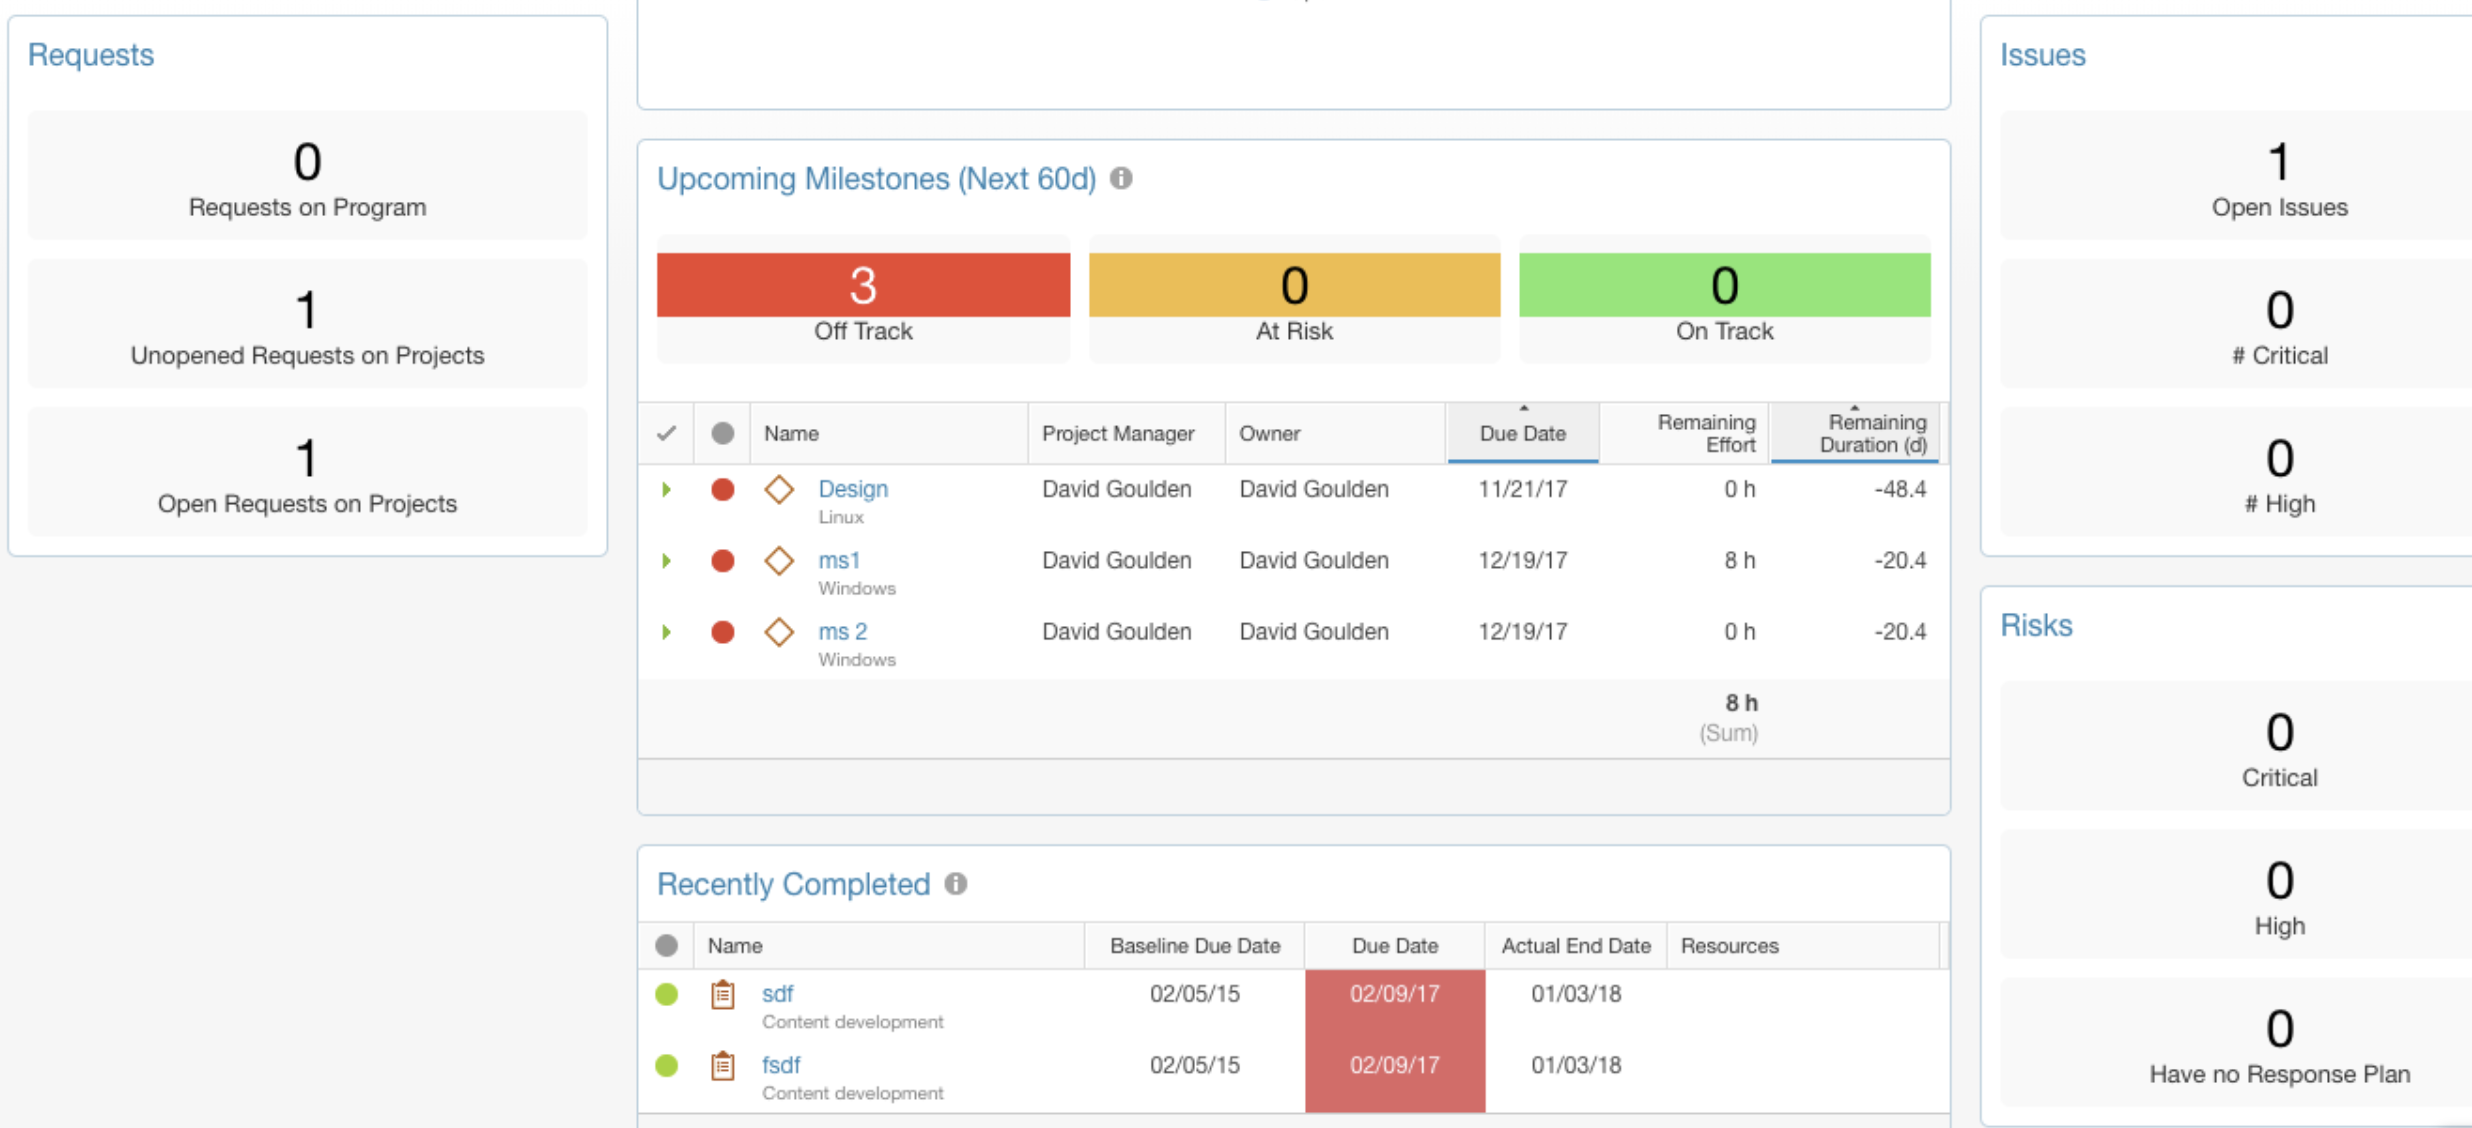
Dashboard showing change requests, milestones and open issues in Clarizen (Source)
The project manager dashboard above has been customized to show risks by assignee, and to show current open issues and change requests. From this screen, users can export or share the project status report directly with stakeholders (to accompany the project status report).
Team progress
PRO TIP: Avoid long narratives.
Project requirements and stakeholder preferences vary, but the best rule for creating your weekly status report is to Keep It Short and Simple (K.I.S.S.). Don’t forget that this project status report is a snapshot: Be clear and concise, not overly detailed.
The fourth, and last, section in your report should measure team productivity, comparing actual progress made over the past week to what was estimated in the previous status report.
Praise teams for notable achievements, and call attention to incomplete tasks. A good way to structure this section is to list:
Tasks scheduled for last week: Include all tasks your team estimated they could complete.
Tasks completed last week: List all tasks your team actually completed.
Tasks scheduled for next week: Any tasks not completed last week should top this list. After that, list tasks planned for the next week.
How project tracking software can help: Our favorite addition to this section is a customized status report. Using project tracking software, you can send a weekly prompt for team members to submit their status summary, key accomplishments, and upcoming tasks for the next week, and the system will automatically collate that information into report format.

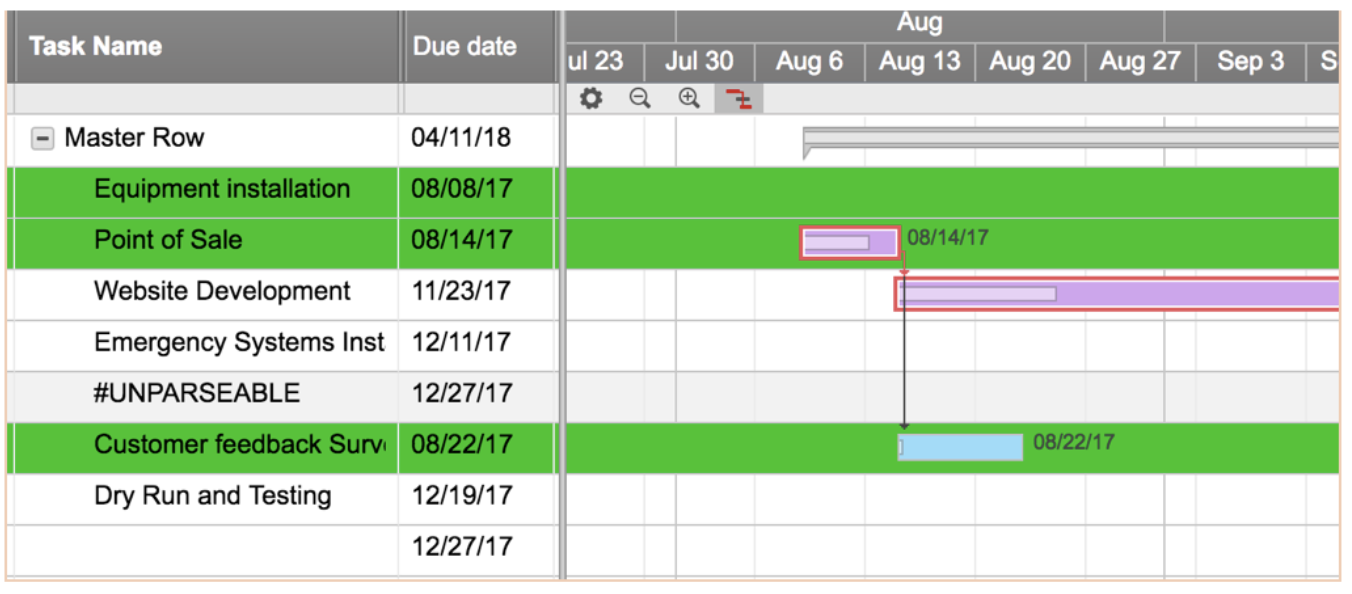
Task deadlines in Smartsheet (Source)
You can then condense this information for stakeholders and embed it in the project status report. Alternatively, you can choose to include the more detailed summary as a supplemental attachment—whatever your stakeholders prefer.
Next steps for project managers
Status reports are a critical part of your stakeholder management strategy. The checklist we’ve included here can be a good jumping off point when developing your own communication strategy.
Here are a few key takeaways to remember as you report to stakeholders:
Don’t bury the lead. Reading patterns and eye-tracking studies suggest that people focus most on the top of the status report and skim the rest. Put the most important info in your executive summary and don’t save any surprises for the end.
A picture is worth a thousand words. Use charts, tables, colors, and data visualization tools to help break up long narratives.
Consistency, consistency, consistency. Pick a set of metrics to measure progress and define the success or failure of initiatives, and then stick to them. Consistency in reporting will allow for easier and more accurate cross-report comparisons.
K.I.S.S. Reports are a snapshot, so keep your status updates short and simple. Come prepared with additional information should your stakeholders ask you to expand on something, but don’t bury them with too much information.
Lastly, the project tracking tools referenced in this article can be a huge asset as you’re creating your reports. If you’re interested in learning more about these types of tools, book an appointment with our project management software experts for a free consultation: Book an appointment here.
Note: The applications selected in this article are examples to show a feature in context and are not intended as endorsements or recommendations. They have been obtained from sources believed to be reliable at the time of publication.