A Guide to Data Visualization and Free Data Visualization Tools
I’ve been thinking about storytelling a lot lately. It’s because I am always looking for ways to weave stories into my articles to make them more engaging for you. If I don’t, you’ll either leave this page unfinished or not retain anything I’ve said.
It’s much the same for your business meetings. Think about it: If you don’t present your ideas creatively and weave impactful stories to convince your colleagues, you’ll not have an engaged audience. You also need to back up your stories with clearly presented data, so everyone can understand it without much difficulty.
A data visualization tool can help you with that. It uses visual elements such as charts, graphs, and maps to break down large volumes of complex data into simple, clear visual representations.
There are many data visualization tools on the market for you to consider. But to help you make the right choice, we’ve created this guide that lists the top five free data visualization tools. But first, let’s begin with the basics of data visualization and how it benefits your business.
What is data visualization?
Data visualization involves breaking down complex datasets into comprehensive and easily digestible graphical representations. It uses elements such as charts, maps, tables, and graphs to organize large datasets and create easy-to-understand visual summaries that make it easier to compare results, identify data patterns or trends, and more.
What are data visualization tools and their benefits?
Data visualization tools are software tools that help convert hardcore statistical data into easy-to-understand visual formats. They provide built-in templates of charts, graphs, maps, and other visual elements that help illustrate data to create annual reports, sales and marketing presentations, investor decks, and more.
Let’s see some benefits of using a data visualization tool:
Aids in decision-making: Graphic elements such as charts, graphs, and maps help present data patterns, correlations, and trends more effectively. This makes it easier for you to understand key insights and make data-backed business decisions.
Provides easy access to data: With data visualization tools, you can create as many data dashboards as you want. These dashboards can be shared with stakeholders (via online links or email), ensuring easy data access for all.
Ensures data accuracy: Visualizations make it easier for you to identify errors in data. You can then correct or remove the inaccurate data from analysis. You can also update the visualizations with real-time data.
Common features of data visualization tools
Here are some common features of data visualization tools your business may benefit from:
Graphic and interactive templates: Offers various customizable templates for charts, graphs, maps, and other visual elements to help illustrate complex data.
Alerts and notifications: Sends you a notification every time a predefined goal is achieved or missed. You also get recommendations to improve your business performance.
Collaboration: Lets you share visualizations with external and internal stakeholders via secure online links and email.
5 free data visualization tools
In this section, we’ve featured five free data visualization tools (listed alphabetically) from Software Advice’s 2020 FrontRunners report for data visualization software. To learn more about the product selection methodology, click here.
Cluvio
Cluvio is a cloud-based business intelligence and data analytics tool that helps you visualize complex data points using graphs and charts.
The tool’s SQL editor offers the code autocomplete feature and lets you reuse code snippets (chunks of SQL codes). Its query parameterization functionality allows you to use precompiled SQL statements instead of writing codes from scratch.
Other data visualization features of Cluvio include:
Customizable R scripts
Push notifications
Embedded analytics
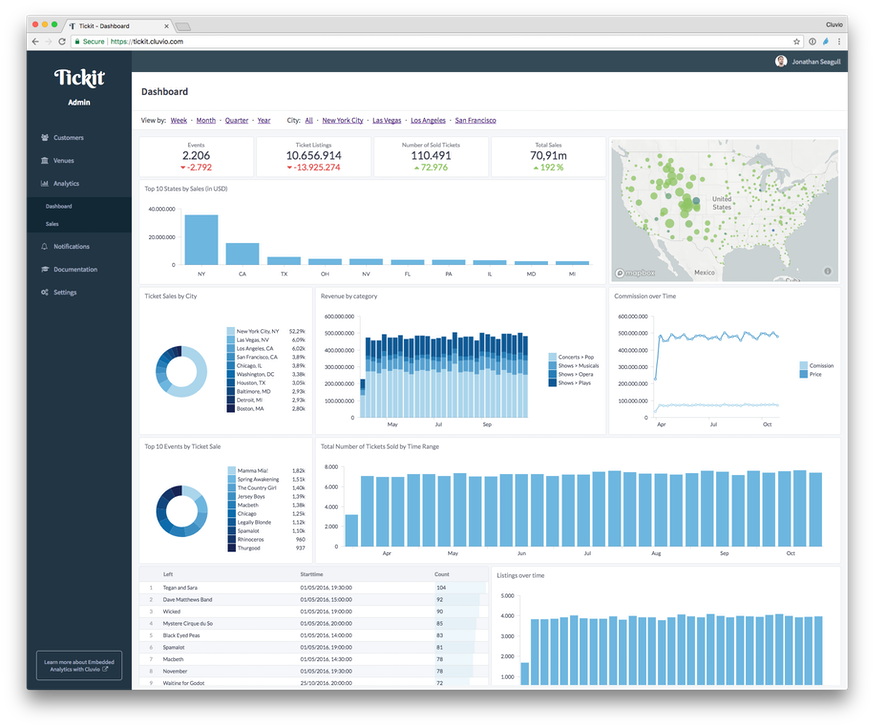
Cluvio’s interactive dashboard (Source)
Databox
Databox is a cloud-based business analytics tool that can integrate with data sources such as HubSpot CRM, Google Analytics, Instagram, and Facebook Ads to pull specific metrics for analyzing your business performance.
The tool offers a DIY dashboard designer that lets you create dashboards without any designing or coding knowledge. All you need to do is connect to a data source and select metrics of your choice, which then get auto-populated on the dashboard.
Other data visualization features of Databox include:
Goal tracking
Advanced data modeling
Key performance indicator (KPI) scorecards
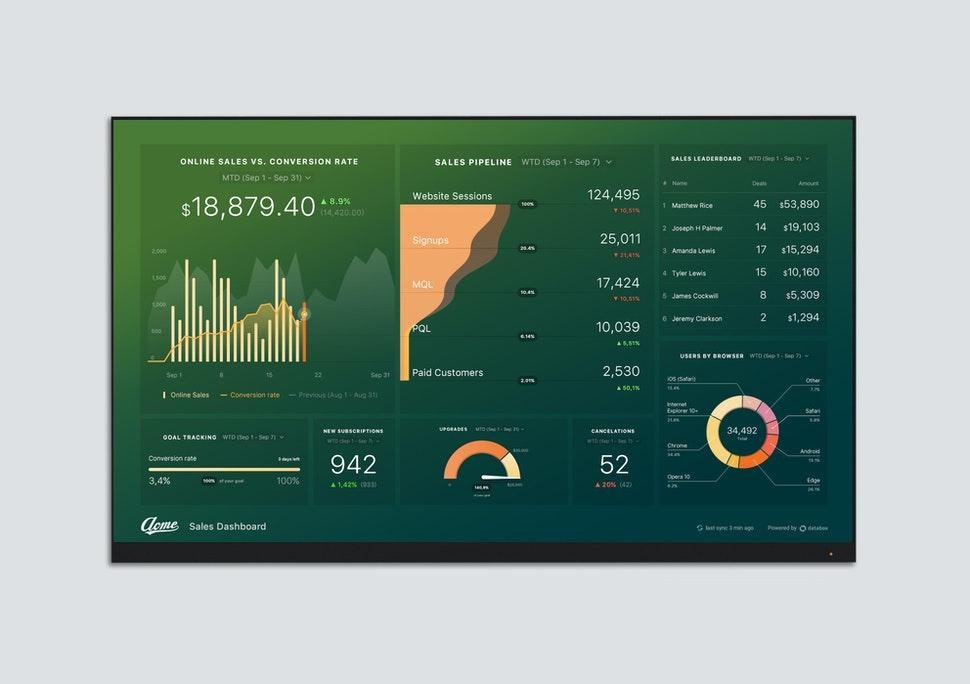
Interactive data visualization using graphs and charts in Databox (Source)
Google Charts
Google Charts is a cloud-based business intelligence tool that offers a library of ready-made charts and data tools that support cross-browser compatibility, which means you can access them on any web browser without using any plugins.
The tool also offers cross-platform portability for iPhones, iPads, and Android devices. You can create multiple dashboards and even match the color of the charts with that of your website (if you want to embed the charts on your website).
Other data visualization features of Google Charts include:
Content management
Dynamic data updates
Reporting and analytics
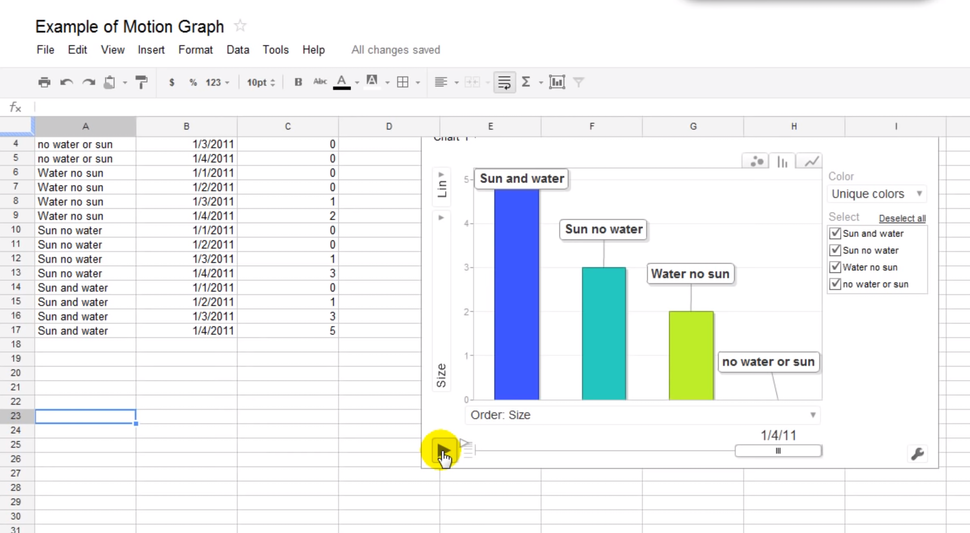
A bar chart in Google Charts (Source)
Google Data Studio
Google Data Studio is a cloud-based reporting solution that lets you connect to multiple sources, including Google Ads, Google BigQuery, Campaign Manager 360, and YouTube, and pull data from them to create custom dashboards and reports.
The tool runs several formulae and mathematical functions to derive insights from the collected data. It lets you add logos and icons; change the background, fill, line, and text colors; and choose from an array of fonts, line styles, and object properties to make your dashboards and reports come to life.
Other data visualization features of Google Data Studio include:
Access control
Data blending
Customizable branding
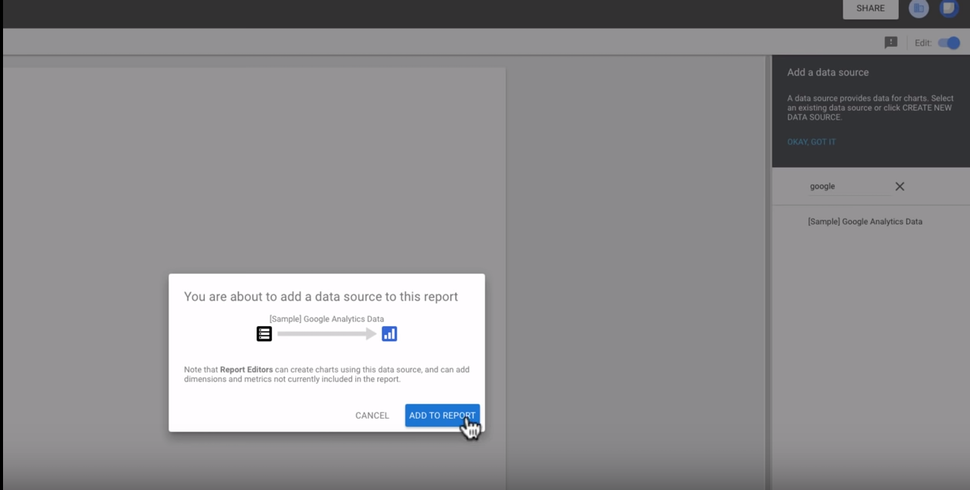
Connecting to a data source in Google Data Studio (Source)
Mode
Mode is a cloud-based analytics platform that lets you analyze complex data and create custom reports.
It offers a collaborative SQL editor that allows multiple users to code and work on data simultaneously. You can use ready-made templates or create custom visualizations using HTML, CSS, and JavaScript. If you want to create everything from scratch with a fresh code, you can use the tool’s integrated data visualization libraries, including D3 and Leaflet.
Other data visualization features of Mode include:
Embedded analytics
Advanced analytics
Helix data engine
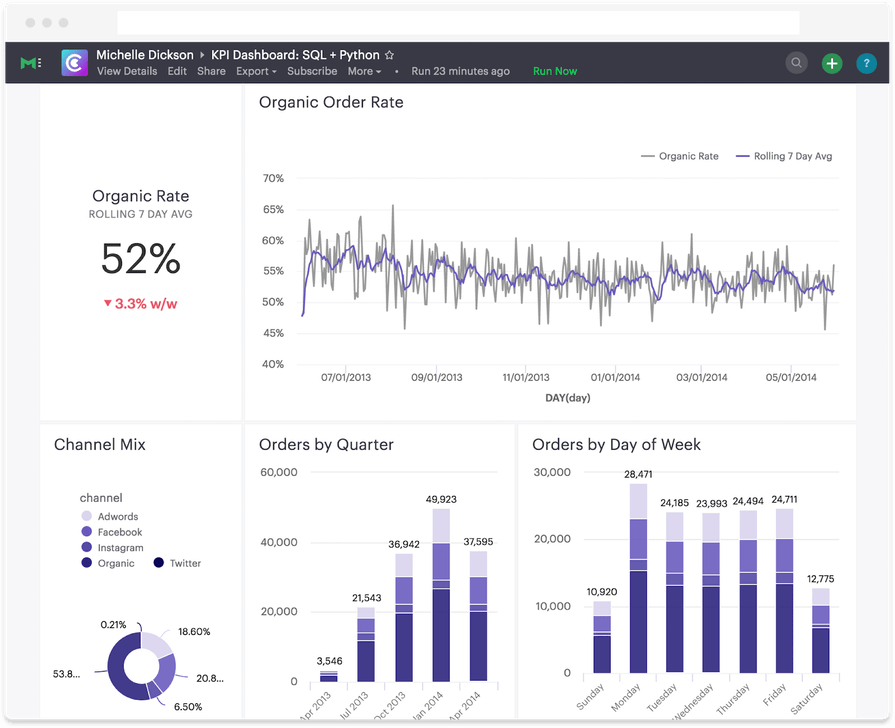
Graphical representation of data in Mode (Source)
Ready to select a data visualization tool?
To get the best out of your software investment, here are some recommendations by Gartner (full content available to Gartner clients only):
Educate your team on visual analytics: Train your team members on how and when to use visual elements such as heat maps and bar charts to communicate data findings effectively.
Make data visualization a team sport: Don’t let data visualization be a solo activity. Instead, get everyone involved and let your team collaborate on large screens, such as a TV, to co-analyze data stories.
Focus on storytelling: Make data storytelling about communicating findings rather than monitoring progress and analyzing causes that derail it. Use data storytelling techniques, supported by infographics, for high-impact use cases.
Need more help? Reach out to our software advisors who’ll help you narrow down your options in 15 minutes or less. Click here to schedule a phone call, or start a live chat here.
Survey methodology
We shortlisted these free products from Software Advice’s 2020 FrontRunners report for data visualization software. Each selected product had a 4+ overall rating and 60+ reviews as on Dec. 3, 2020.