The Key HR Metrics Every Small Business Should Be Tracking
The numbers don’t lie: HR is scared of numbers.
The latest survey from IPMA-HR shows that while virtually all respondents say technology is important for HR goals, more than half (57 percent) report negative impacts from data integrity.
Whether you’re an HR manager at a 250+ employee company or a small business owner with only one other worker, becoming data-driven when it comes to your human capital management strategy isn’t just the best route to organizational growth and prosperity—it’s the only route.
If you’re part of the 63 percent that relies solely on intuition and gut-instinct to make important decisions, you’re guaranteed to miss important trends, repeat mistakes and fall behind competitors.
If you don’t even know where to begin, you’re in the right place. Here are four key HR metrics every small business should be tracking to have an accurate pulse on their employees.
Click on a link to jump to that section:
Key HR Metric #1: Employee Turnover Rate
Key HR Metric #2: Employee Engagement
Key HR Metric #3: Total Overtime Cost
Key HR Metric #4: Profit Per Employee
Are You Ready to Become Data-Driven?
Key HR Metric #1: Employee Turnover Rate
How to calculate it:
First, find your average number of employees in a given period:
= (# of employees at beginning of period + # of employees at end of period) / 2
Once you have that, divide the number of employees who left over that same period by the average and multiply by 100 to find the employee turnover rate:
= (# of employees who left / average # of employees) x 100
An example:
Say you started with 20 employees on January 1 of last year and ended with 24 on December 31. Find your average employee count:
(20 + 24) / 2 = 22
If three employees left during that period, you can now find your employee turnover rate:
(3 / 22) x 100 = 13.6 percent
Why it’s a key HR metric:
Turnover is a key HR metric because a revolving door is the biggest red flag that you have a dysfunctional workforce and poor employee satisfaction. High turnover is also one of the more expensive problems you can have in HR.
When a worker leaves, the cost to find a replacement, recruit them, move them through the hiring process, onboard them and train them can cost anywhere from 16 percent of salary for lower positions all the way up to 213 percent (!) of salary for roles at the senior and executive levels when you factor in lost productivity.
Avoiding high turnover is critical, but what constitutes “high” isn’t going to be the same for every small business.
Calculate your turnover rate every month (or every year, if you’re smaller), then use tools like the Bureau of Labor Statistics (BLS) to compare it with the average for your industry and region.
If you’ve determined that your turnover rate is too high, you can break it down further into the number of employees who voluntarily and involuntarily turnover to diagnose the problem.
If voluntary turnover is high, it’s likely a compensation or management issue.
If involuntary turnover is high, you’re hiring the wrong people.
You can also dive deeper and use historical data to learn which specific employees are most likely to leave next. We show you how to do that here.
Key HR Metric #2: Employee Engagement
How to calculate it:
You can calculate employee engagement using a number of different methods and tools, but the quickest and easiest way is through something called the Employee Net Promoter Score (eNPS). Borrowed from the world of customer service, eNPS is a single metric that can tell you how much of your workforce is advocating your company to others.
To calculate eNPS, you first need to send an anonymous survey to your workers that includes this question:
“On a scale from 0 – 10, how likely are you to recommend working at this company to a friend?”
When you have all the results, categorize them as either a “detractor” (scores 0 – 6), “neutral” (scores 7 – 8) or a “promoter” (scores 9 – 10):

Then simply subtract the percent of the total that are detractors from the percent of the total that are promoters:
eNPS = % Promoters – % Detractors
You can administer this survey on a regular basis (monthly, quarterly, annually) to measure if eNPS is rising or falling in your workforce.
An example:
Say you send out an eNPS survey to 100 employees, and the responses come back as follows:
eNPS survey
Response | # of Employees |
0 | 3 |
1 | 4 |
2 | 2 |
3 | 3 |
4 | 5 |
5 | 16 |
6 | 20 |
7 | 29 |
8 | 13 |
9 | 3 |
10 | 2 |
Your eNPS in this case would then be -48 percent (5 percent – 53 percent), meaning you have 48 percent more detractors than promoters. Not good!
Why it’s a key HR metric:
If employee turnover lets you know when your workforce is collapsing, then employee engagement does the opposite.
It’s a key HR metric because it tells you how much of your workforce is enthusiastic about their work, committed to the company and championing your organization to others.
Though you shouldn’t expect your entire workforce to be engaged (Gallup notes that only 30 to 35 percent of workers in the U.S. are engaged on average), you should be striving to increase this critical metric constantly.
Research has shown again and again that engaged workers stay longer, work harder, perform better and boost profits.
Employee Net Promoter Score is a great starting off point, but boiling down engagement to one metric only scratches the surface.
As Gartner points out (content only available to Gartner clients), effective employee engagement metrics should attempt to cover five categories:
Current job understanding
Relationship with direct supervisor
Perception of senior leadership
Opportunities for career growth and development
Work conditions
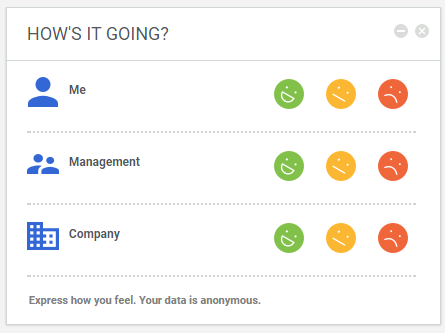
To measure and act on all of these facets effectively, consider investing in employee engagement software. Besides automatically sending periodic pulse surveys to workers to measure engagement levels in a variety of ways, these platforms can also offer insight on what areas you should focus on.

Pulse survey in Saba
Key HR Metric #3: Total Overtime Cost
How to calculate it:
Calculating overtime is different depending on if full-time employees are hourly, salaried non-exempt or receive tips. Here’s a breakdown:
How to Calculate Overtime for Different Workers
Hourly employees (federal law) | Step 1) Calculate overtime pay: = Employee wage rate x 1.5 x # of hours worked per week over 40 |
Salaried employees (fixed schedule) | Step 1) Determine their hourly wage rate: = Employee’s gross salary for a pay period / # of non-overtime hours worked in a pay period Step 2) Calculate overtime pay: = Hourly wage rate x 1.5 x # of overtime hours worked |
Tipped employees (federal law) | Step 1) Determine their regular overtime rate: = Total wage rate x 1.5 Step 2) Determine their tip credit: = Total wage rate – direct cash wage rate Step 3) Calculate their adjusted overtime rate: = Regular overtime rate – tip credit Step 4) Calculate overtime pay: = Adjusted overtime rate x # of hours worked per week over 40 |
The math can change depending on what state or city you’re operating in so if you’re not sure what the laws are in your local area, talk to your legal counsel.
An example:
For simplicity’s sake, let’s say you have one hourly employee who makes minimum wage ($7.25/hr) and two salaried employees who each make $800 every pay period.
Let’s also assume that in the last pay period, the hourly employee worked 12 overtime hours and the salaried employees each worked 7 overtime hours.
For the hourly employee:
$7.25 x 1.5 x 12 = $130.50
For the salaried employees:
$800 / 40 = $20
$20 x 1.5 x 7 = $210
$210 x 2 workers = $420
Total overtime cost for this pay period:
$130.50 + $420 = $550.50
Why it’s a key HR metric:
Total overtime cost is a key HR metric because if it keeps rising at your small business, it’s pointing to one of two glaring issues that need to be remedied quickly: either you don’t have enough employees or you’re allocating worker shifts inefficiently.
The latter is especially common. According to a study by software vendor WorkJam, 72 percent of retail managers are unsatisfied with their ability to create schedules that “keep employees happy while also accommodating the store’s needs.”
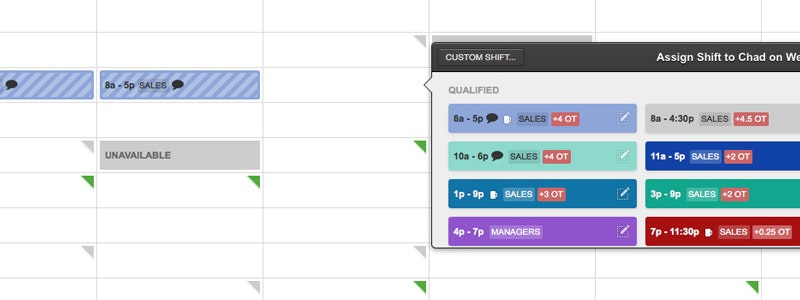
If bad schedules are leading to paying more overtime, check out employee scheduling software. These platforms can automatically create the most optimized schedule within the constraints of your workforce and flag any shifts that could potentially be extra costly.

Overtime tracking in When I Work
Key HR Metric #4: Profit Per Employee
How to calculate it:
If calculating profit per employee sounds simple, it’s because it is. Like we did with employee turnover rate, first calculate your average number of employees:
= (# of employees at beginning of period + # of employees at end of period) / 2
Then divide total profit (a.k.a. net income) over that same period by the average employee number for profit per employee:
= Total profit / average # of employees
An example:
You had 14 employees on January 1 and 17 employees on December 31. Find your average employees count:
(14 + 17) / 2 = 15.5
You made $30,000 in total profit last year. Find your profit per employee:
$30,000 / 15.5 = $1,935 per employee
Why it’s a key HR metric:
Profit per employee is a key HR metric because it cuts to the heart of the matter when it comes to staffing and productivity: how much is each individual contributing back to the company?
It’s also as good a number as any to weigh yourself against a competitor*: If you’re both making $30,000 a year, but they’re doing it with 10 workers while you’re doing with 20, you’re losing.
*You can find employee numbers for other businesses pretty easily on LinkedIn. Profit numbers, sadly, are only available if they’re a publicly traded company.
If you find that your profit per employee is declining over time or pales in comparison to the competition, it’s a sign you’re either growing too fast, your costs are out of control or you’re failing to train your workers properly.
Are You Ready to Become Data-Driven?
Because it deals with those complex beasts we call people, it’s often assumed that the best HR managers lead by the heart and gut first, and the brain second. But the reality couldn’t be more different. Leveraging workforce analytics and acting based on what it says is critical to becoming effective at workforce management.
This isn’t a change that happens overnight, especially if you don’t consider yourself a “numbers” person, but here are some steps you can take to get started:
Start off small. Don’t think you have to start tracking every metric under the sun right away. You’ll succumb to data overload. Focus on these four metrics first—what data you need, how you’re going to obtain it, how often you’ll analyze and report on it—then work your way up.
Sit on data before acting on it. When a crucial metric tanks one month, it can be tempting to hit the panic button and make a ton of significant changes to right the ship. Relax! Before you act on data, consider all of the factors that could explain why key metrics changed.
Stop relying on spreadsheets. Spreadsheets are simple, prone to errors and require a ton of manual curation and hand-holding. Investing in an HRIS to store important employee data will save you time, cut down on mistakes and offer better insights.