
Find the best Business Intelligence Tools
Compare Products
Showing 1 - 20 of 2263 products
Sort by
Reviews: Sorts listings by the number of user reviews we have published, greatest to least.
Sponsored: Sorts listings by software vendors running active bidding campaigns, from the highest to lowest bid. Vendors who have paid for placement have a ‘Visit Website’ button, whereas unpaid vendors have a ‘Learn More’ button.
Avg Rating: Sorts listings by overall star rating based on user reviews, highest to lowest.
A to Z: Sorts listings by product name from A to Z.


Domo
Domo
FrontRunners 2024
Domo puts data to work for everyone so they can multiply their impact on the business. Our cloud-native data experience platform goes beyond traditional business intelligence and analytics, making data visible and actionable with ...Read more about Domo

Grow
Grow
FrontRunners 2024
Grow is a cloud-based, business analytics and reporting solution suitable for small to midsize organizations. The solution allows users to create customizable dashboards for monitoring business workflows and key activities. Grow...Read more about Grow

SplashBI
SplashBI
SplashBI is a cloud-based business analytics platform that provides pre-built insights to help businesses make data-driven decisions. The platform offers a wide range of analytics solutions, including people analytics, sales analy...Read more about SplashBI

Kyligence Zen
Kyligence Zen
Kyligence Zen is the decision intelligence platform that provides accurate decision support for businesses, using one reliable source of metrics, designed for modern companies. It empowers decision makers with advanced, AI-powered...Read more about Kyligence Zen
Talk with us for a free
15-minute consultationSoftware Advice is free because vendors pay us when they receive sales opportunities.
This allows us to provide comprehensive software lists and an advisor service at no cost to you.
This allows us to provide comprehensive software lists and an advisor service at no cost to you.


Meet Eric, a software expert who has helped 1,534 companies select the right product for their needs.
Talk with us for a free
15-minute consultationSoftware Advice is free because vendors pay us when they receive sales opportunities.
This allows us to provide comprehensive software lists and an advisor service at no cost to you.
This allows us to provide comprehensive software lists and an advisor service at no cost to you.
Tell us more about your business and an advisor will reach out with a list of software recommendations customized for your specific needs.
STEP 1 OF 4
How many are in your organization?

ActivTrak
ActivTrak
ActivTrak helps companies unlock productivity potential. Our award-winning workforce analytics and productivity management software provides expert insights that empower people, optimize processes, and maximize technology. Addit...Read more about ActivTrak

Hevo
Hevo
Hevo is a no-code, bi-directional data pipeline platform specially built for modern ETL, ELT, and Reverse ETL Needs. It helps data teams streamline and automate org-wide data flows that result in a saving of ~10 hours of engineeri...Read more about Hevo

TARGIT
TARGIT
TARGIT Decision Suite is a business intelligence and analytics solution that offers visual data discovery tools, self-service business analytics, reporting and dashboards in a single, integrated solution. TARGIT combines the ...Read more about TARGIT

ARGUS Developer
ARGUS Developer
ARGUS Developer is a real estate development pro forma and management software solution that helps you manage complex, multi-staged development projects. The software gives users complete control from feasibility to completion. U...Read more about ARGUS Developer

Jira
Jira
Jira Software is a business process management tool used by agile teams to plan, track and release software. Jira Software supports Scrum, Kanban, a hybrid model or another unique workflow. Jira enables users to create project r...Read more about Jira

Asana
Asana
Asana is a comprehensive project management tool that offers a range of technical features to streamline workflows and enhance collaboration within teams. With its user-friendly interface and robust capabilities, Asana provides or...Read more about Asana

Canva
Canva
Canva is a cloud-based graphic design tool used to create on-brand marketing content, sales presentations, training videos and more by companies of all sizes. This solution includes features such as drag-and-drop design and photo ...Read more about Canva
Google Analytics 360
Google Analytics 360
Google Analytics 360 is an enterprise-level analytics platform with in-depth performance indicators, such as ROI analysis reports. The app's primary function is to provide insights into customer behavior interactions with websites...Read more about Google Analytics 360

ADP Workforce Now
ADP Workforce Now
ADP Workforce Solution is suited for businesses with more than 50 employees looking to streamline HR processes. ADP Workforce Now includes capabilities such as payroll processing and tax filing, performance management, compensatio...Read more about ADP Workforce Now

Dynamics 365
Dynamics 365
Microsoft Dynamics 365 is a cloud-based CRM ecosystem for small, medium and enterprise organizations, with a focus on Sales, Field Service, Customer Service complete with strong integrations with Microsoft’s other Office 365 offer...Read more about Dynamics 365

monday.com
monday.com
monday.com is an award-winning work and project management platform that helps teams of all sizes plan, prioritize, manage, and execute their work more effectively. The platform offers solutions for a wide range of use-cases such...Read more about monday.com

Smartsheet
Smartsheet
Smartsheet is a work execution platform and collaboration tool with a familiar spreadsheet-like interface that helps teams plan, track, and manage projects in real-time. Smartsheet features include a range of project management to...Read more about Smartsheet

Visio
Visio
Visio, a Microsoft 365 solution, is a diagramming tool that can be used by businesses of all sizes to create visual charts for team collaboration. With Visio, teams can connect diagrams and charts to real-time data and automate wo...Read more about Visio

Rippling
Rippling
Rippling gives businesses one place to run HR, IT, and Finance. It brings together all of the workforce systems that are normally scattered across a company, like payroll, expenses, benefits, and computers. So for the first time e...Read more about Rippling

Zapier
Zapier
Founded in 2011, Zapier has helped over 1.8 million individuals and businesses with their automation needs. Zapier moves info between your web apps automatically, so you can focus on your most important work. Build custom workfl...Read more about Zapier

BambooHR
BambooHR
Instead of using fragmented spreadsheets, limited or clunky software, and physical paper, BambooHR helps you centralize your data and automate the way you complete key HR tasks. As you hire, onboard, and pay your employees, every ...Read more about BambooHR
Popular Comparisons


Buyers Guide
Last Updated: March 16, 2023Business intelligence (BI) software has gained considerable traction since its introduction as "decision support systems" in the 1960s. Today, there are over 100 BI software companies selling business intelligence tools.
We put together this buyer's guide to help buyers understand the BI tools market. In this guide, we'll review:
What is business intelligence software?
Comparing business intelligence tools
Common Features of Business Intelligence Software
What is business intelligence software?
Business intelligence software is data visualization and data analytics software that helps organizations make more well-informed decisions. Business intelligence tools connect to the business's data warehouse, ERP systems, marketing data, social media channels, Excel data imports, or even macroeconomic information.
The business intelligence market is growing rapidly because of the proliferation of data to analyze. Over the past few decades, companies that have deployed Enterprise Resource Planning (ERP), Customer Relationship Management (CRM) and other applications are now sitting on a mountain of data that can be analyzed. In addition, the growth of the Web has increased the demand for data analysis tools that can analyze large data sets.
One of the biggest trends in the BI market is the shift in software architecture and design to more user-friendly self-service applications. These applications are now being used by business users—not just IT staff—to pull ad-hoc reports, create interactive dashboards, and even allow end users to perform advanced analytics functions on the BI platform.
Medical practices and doctors looking for solutions that can function with their existing medical software might be interested in healthcare BI software.
Comparing business intelligence tools
There are many popular BI solutions on the market, and it can be hard to know what distinguishes one product from another and which is right for you. To help you better understand how the top BI systems stack up against one another, we created a series of side-by-side product comparison pages that break down the details of what each solution offers in terms of pricing, applications, ease of use, support and more:
Top Qlik Sense Comparisons | Top Qlikview Comparisons | Top Tableau Comparisons |
Top Spotfire Comparisons |
|
|
Common Features of Business Intelligence Software
BI software can be divided into three broad application categories: data management tools, data discovery applications and reporting tools (including interactive dashboards and data visualization software). In the next section, we'll explain how these analytics platforms can help your organization's decision-making process become more data-driven.
The BI tool you'll need depends on how your data is currently managed and how you would like to analyze it. For example, if it is currently scattered across disparate transactional databases, you might need to build a data warehouse to centralize it and invest in data management tools that offer Extract, Transform and Load (ETL) functionality to move and re-structure it.
Once data is given a common structure and format, you can invest in data discovery solutions such as Online Analytical Processing (OLAP), data mining and semantic or text mining applications, with the capability to create custom, ad hoc reports. And because information is stored within the warehouse, users can quickly pull reports without impacting the performance of the organization’s software applications, such as CRM, ERP and supply chain management solutions.
We’ve illustrated this concept in the image below:
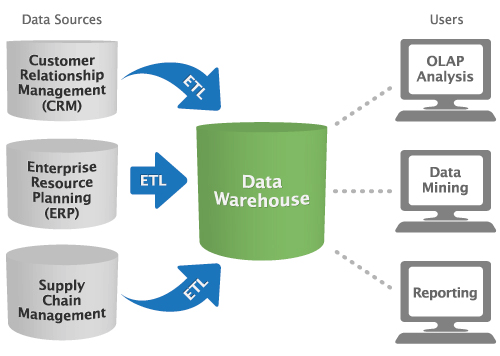
But this isn’t the only way to implement business intelligence software within your organization. If you’re only analyzing data from a single source, ETL and data warehouses are unnecessary. Alternatively, you might require multiple warehouses, and thus, require different tools to connect data between both these servers and other analytics tools that need access to this data.
Regardless of your unique business needs, any BI tool you buy should have some key features:
Data quality management
Extract, transform and load (ETL)
Data mining
Online analytical processing (OLAP)
Predictive analytics
Semantic and text analytics
Data visualizations
Interactive dashboards
Report writers
Scorecarding
Ad hoc reporting
Data management tools
Better decision-making starts with better data. Data management tools help clean up "dirty data," organize information by providing format and structure and prepare data sources for analyses.
Functionality | Description |
Data quality management | Helps organizations maintain clean, standardized and error-free data. Standardization is especially important for business intelligence tools that integrate data from diverse sources. Data quality management ensures that later analyses are correct and can lead to improvements within the business. |
Extract, transform and load (ETL) | Collects data from outside sources, transforms it and then loads it into the target system (a database or a data warehouse). Because primary data is often organized using different schemas or formats, analysts can use ETL tools to normalize it for use in analytics. |
Data discovery applications
The ability to sift through data and come to meaningful conclusions is one of the most powerful benefits of adopting business intelligence tools. Data discovery applications help users make sense of their data, whether it be through quick, multivariate analysis during OLAP or via advanced algorithms and statistical computations during data mining.
Functionality | Description |
Sorts through large amounts of data to identify new or unknown patterns. It is often the first step that other processes rely on, such as predictive analytics. Databases are often too large or convoluted to find patterns with the naked eye or through simple queries. Data mining helps point users in the right direction for further analysis by providing an automated method of discovering previously neglected trends. | |
Enables users to quickly analyze multidimensional data from different perspectives. It is typically made up of three analytical operations: data consolidation, data sorting and classification ("drill-down"), and data analytics from a particular perspective ("slice-and-dice"). For example, a user could analyze sales numbers for various products by store and by month. OLAP allows users to produce this analysis. | |
Analyzes current and historical data to make predictions about future risks and opportunities. An example of this is credit scoring, which relies on an individual's current financial standing to make predictions about their future credit behavior. | |
Semantic and text analytics | Extracts and interprets large volumes of text to identify patterns, relationships and sentiment. For example, the popularity of social media has made text analytics valuable to companies with a large social footprint. Understanding semantic trends is a powerful tool for organizations evaluating purchase intent or customer satisfaction among users of these channels. |
Reporting tools
In the words of John W. Tuckey, “the greatest value of a picture is when it forces us to notice what we never expected to see.” Reporting applications are an important way to present data and easily convey the results of analysis.
Business intelligence users are increasingly business users—not IT staff—who need quick, easy-to-understand displays of information. In response, software vendors have been working to mask the complexity of these applications and increasingly focus on the user experience.
Functionality | Description |
Helps users create advanced interactive dashboard representations of data via simple user interfaces. The ability to visualize information in a graphical format (as opposed to words or numbers) can help users understand data in a more insightful way. In addition, new interactive tools can help teams use analytics and manipulate reports in real-time. | |
Dashboards typically highlight key performance indicators (KPIs), which help managers focus on the metrics that are most important to them. Dashboards are often browser-based, making them easily accessible by anyone with permissions. | |
Report writers | Allows users to design and generate custom reports. Many CRM and ERP systems include built-in BI reporting tools, but users can also purchase standalone applications, such as Crystal Reports, to create ad hoc reports based on complex queries. This is especially helpful for organizations that constantly use analytics and need to generate new reports quickly. |
Scorecarding | Scorecards attach a numerical weight to performance and map progress toward goals. Think of it as dashboards taken one step further. In organizations with a strategic performance-management methodology (e.g., balanced scorecard, Six Sigma etc.), scorecards are an effective way to keep tabs on key metrics. For example, a scorecard might establish a grade of “A+" to 40 percent year-over-year growth if the goal was set at 14 percent. |
What type of buyer are you?
Before evaluating software, you must determine what type of buyer you are.
Business users and departmental buyers. These buyers favor small data-discovery vendors and BI tools over the big, traditional BI systems. Ease-of-use and fast deployment are more important than in-depth functionality and integration. They are usually business users rather than IT staff.
IT buyers. Traditional buyers are more focused on functionality and integration within their information infrastructure stacks or other ERP applications. Integration across different entities and departments is usually more important than ease of use.
Market trends to understand
As you begin your software comparison and evaluation, there are a couple trends to consider:
In-memory processing: OLAP systems of the past would pre-calculate every possible combination of data. These calculations would be stored in the “cube,” and users could retrieve them when they needed a certain analysis. Creating these cubes was very time-consuming—sometimes taking as long as a year—and required expertise. Today, computer processors and memory are faster, cheaper and more powerful overall. This same process can happen in-memory, rather than using a disk-based approach with cubes. Analytics software built on an in-memory architecture can retrieve data and perform calculations in real-time or on-the-fly.
Big Data: The Internet is rapidly creating vast amounts of data. This phenomenon is known as "big data" among IT and business leaders. Business analytics software companies are beefing up their data warehousing and analytics capabilities to keep up with demand.
However, according to Gartner, through 2015, 85% of Fortune 500 organizations will be unable to exploit big data for competitive advantage. The right BI tools can help harness the power of so much data.
Companies dealing with large amounts of data may also want to consider investing in dedicated IT security suites to support their computer security needs.
Business users to outnumber IT staff: This is a major trend playing out in the market. More business users—rather than traditional IT staff—are evaluating and purchasing software. So usability is becoming more important than functionality during software evaluations. As a result, small data discovery vendors that develop really good interactive visualization tools are gaining market share. Meanwhile, traditional BI vendors are parroting new market entrants by promoting ease of use.
Software-as-a-Service (SaaS): A growing number of organizations are considering SaaS or “cloud” BI software instead of traditional, on-premise software that you install on-location. Cost is a major driver of this trend. The poorly performing economy is motivating companies to look at lower-cost BI software from SaaS and open source vendors. Of course, perceived ease of use, faster implementations and reduced IT needs are also driving this trend. On-premise BI vendors are responding by committing development resources to cloud technology.
**[
Mobile BI applications:](https://www.softwareadvice.com/bi/mobile-business-intelligence-comparison/)** Proliferation of the iPhone, iPad and other mobile devices is pushing vendors (e.g., Microsoft and Oracle) to develop on-the-go business intelligence applications. Analysts think mobile BI could expand the population of BI users to a larger, mainstream audience.