

Best Manufacturing BI Software of 2026
Updated January 29, 2026 at 2:27 AM
Written by Olivia Montgomery, PMP
Associate Principal Analyst
Edited by Mehar Luthra
Team Lead, Content
Reviewed by Lindsay Robbins
Senior Advisor

Talk with us for a free 15-min consultation
Expert advisors like Jacqueline, who have helped 1,000+ companies, can find the right software for your needs.
- All Software
- Top Software
- Buyer's Guide
- Frequently Asked Questions
- Popular Comparisons
Manufacturing business intelligence (BI) software generates real-time data reports and visual data insights, enabling more informed decision-making. Manufacturing is the largest segment of BI software buyers who spoke with our team in the last year. We analyzed the buyers' data and the 995 verified manufacturing BI reviews to identify products rated highest for usability, value, functionality, and customer support. Our site features over 192 vendors to help you find the right product to meet your needs. To help you narrow it down, I worked with our manufacturing business intelligence (BI) software advisors to curate a list of recommended productsi and a list of highly-rated manufacturing business intelligence (BI) software based on user reviews.
Manufacturing BI Software
Sort by
Reviews: Sorts listings by the number of user reviews we have published, greatest to least.
Average Rating: Sorts listings by overall star rating based on user reviews, highest to lowest.
Alphabetically (A-Z): Sorts listings by product name from A to Z.

Grow is a cloud-based, business analytics and reporting solution suitable for small to midsize organizations. The solution allow...Read more about Grow
Grow's Best Rated Features
See All
Grow's Worst Rated Features
See All

Google Analytics 360 is an enterprise-level analytics platform with in-depth performance indicators, such as ROI analysis report...Read more about Google Analytics 360
Google Analytics 360's Best Rated Features
See All
Google Analytics 360's Worst Rated Features
See All

Hevo is a no-code, bi-directional data pipeline platform specially built for modern ETL, ELT, and Reverse ETL Needs. It helps da...Read more about Hevo
Hevo 's Best Rated Features
See All
Hevo 's Worst Rated Features
See All

BroadPeak is a low-code data integration solution designed for energy and commodity trading firms, enabling seamless connectivit...Read more about BroadPeak

Octoparse is a leading web scraping tool that empowers users to easily extract data from any website without coding. 🌱Key Feat...Read more about Octoparse
Octoparse's Best Rated Features
See All
Octoparse's Worst Rated Features
See All
Best Manufacturing BI Software for 2025
Highest Rated

Phocas

Based on our analysis of manufacturing BI tools with the most market demand, Phocas is the highest rated.
SMB owners seeking control of their data without a steep learning curve might find Phocas helpful. The platform can be leveraged by users operating in wholesale distribution, retail, automotive, and construction industries, among others. The handy part is that from day one, users can extract actionable insights from ERP and business systems data. Phocas also offers user-friendly dashboards and ad-hoc query features to accommodate users with various levels of skill in customizing and formatting data.
- Reviewers Perspective
“With Phocas Software, users can quickly and easily access real-time data and analytics to help them make better decisions and optimize their operations.”
NBNoam Bardin
Founder
Used for 1-2 years
We analyzed 127 verified user reviews for Phocas to find out what actual users really think.
Data analysis
Users find Phocas highly effective for data analysis, appreciating its ease of use and real-time data access. They value the ability to integrate multiple data sources and quickly gain insights, making it a powerful tool for decision-making. Additionally, users highlight the software's capability to handle large datasets and provide comprehensive data visualization, even for non-technical users.Customer service
Reviewers commend Phocas for its excellent customer service, noting the team's willingness to assist with any questions or problems. They appreciate the customer-centric approach and the support provided by account managers, which enhances their overall experience. Users also find the software helpful for tracking customer spending and identifying areas where customer engagement can be improved.Sales tracking
Users praise Phocas for its robust sales tracking features, which help them monitor sales performance and profitability. They find the tool useful for analyzing sales data and generating specific sales information, aiding in better account management. Additionally, reviewers appreciate the software's ability to provide detailed insights into sales trends and performance metrics. - Screenshots


Best Free


Out of the most popular manufacturing BI products, Microsoft Power BI is the highest rated that also offers a free plan.
SMB teams that need high-quality analytics without a hefty price tag can benefit from Microsoft Power BI. More specifically, it caters to businesses operating in the automotive, defense, education, manufacturing, and healthcare industries, among others. The tool works by connecting to multiple data sources, ensuring users get clear, actionable insights through real-time reports. Its artificial intelligence (AI)-powered tools help uncover trends, while Microsoft Fabric and OneLake help scale operations.
- Reviewers Perspective
“Connectivity to multiple data sources: Power BI supports a wide range of data connections, allowing you to import and integrate data from multiple sources, such as databases.”
TLTâmara Lima
Supply Ops Analyst
Used for 2+ years
We analyzed 1,739 verified user reviews for Microsoft Power BI to find out what actual users really think.
Data analysis
Users appreciate Microsoft Power BI for its robust data analysis capabilities, allowing them to connect to multiple data sources and integrate data seamlessly. They value the ability to generate insightful reports and perform complex calculations using DAX and Power Query. Additionally, users find the platform's AI and machine learning features helpful in uncovering trends and making informed business decisions.Data visualization
Reviewers find Microsoft Power BI's data visualization tools impressive. They offer a wide range of options, such as charts, tables, and interactive maps. Users also appreciate the ability to create visually appealing and impactful dashboards that help convey information clearly. In addition, they highlight the ease of sharing insights and the seamless integration with other Microsoft Office products.Dashboard creation
Users enjoy the intuitive experience of creating dashboards with Microsoft Power BI, emphasizing the drag-and-drop functionality that simplifies the process. They value the ability to customize and create interactive dashboards that can be tailored to specific needs. Additionally, users find the platform's integration with other Microsoft products beneficial for building comprehensive and professional dashboards. - Screenshots


Most Affordable

Qlik Sense

Our analysis of the manufacturing BI tools with the market-demand tools shows that Qlik Sense offers the lowest-priced paid plan.
Qlik Sense can help teams looking for advanced analytics that won’t break the bank. Most of our reviewers are SMB owners and teams, citing the tool’s associative engine, which reveals hidden data relationships and provides detailed insights. Its AI-powered features and intuitive drag-and-drop interface simplify data prep, discovery, and presentation. Teams use its mobile-friendly tools to access data and make decisions.
- Reviewers Perspective
“The intuitive associative engine and powerful visualization capability within Qlik sense as provided a powerful platform which allows us to develop user engaging, intuitive and agile data analytics tools which drive informed, timely and impact business decision making.”
DEDave Elliott
Solutions and Data Innovation Manager
Used for 2+ years
We analyzed 262 verified user reviews for Qlik Sense to find out what actual users really think.
Dashboards
Users commend Qlik Sense for its dynamic dashboard creation, which allows them to build and customize dashboards quickly and efficiently. They find the platform intuitive for both users and developers, facilitating the creation of actionable and visually-appealing dashboards. Additionally, reviewers highlight the flexibility of Qlik Sense in integrating extract, transform, and load (ETL) processes with dashboarding, enhancing their overall data management experience.Data visualization
Reviewers find Qlik Sense's data visualization features intuitive and effective, enabling them to create interactive visualizations with ease. They appreciate the software's powerful visualization capabilities, which support informed decision-making through engaging and dynamic graphical representations. Users also note that the tool is accessible to non-technical users, making it a valuable asset for diverse teams.Data analysis
Users appreciate Qlik Sense for its robust data analysis capabilities, allowing them to process and analyze large datasets efficiently. They find it versatile in connecting to various data sources, including cloud-based and big data platforms, which enhances their analytical workflows. Additionally, users highlight the tool's user-friendly interface and powerful ETL capabilities, making it easier to derive valuable insights from complex data. - Screenshots


Best Value for Money

Looker

Among the most popular manufacturing BI tools, Looker is the highest rated for value for money.
SMBs with manufacturing operations can find value in Looker for its robust data analysis, although it can be used by teams and businesses across various industries. It combines data from multiple sources, and users can turn it into actionable insights through customizable dashboards and modeling tools. Our reviews cite the tool’s visualization features, which help explore trends, improve operations, share findings, and identify cost-saving areas. Backed by Google Cloud, Looker offers affordability, security, and scalability.
- Reviewers Perspective
“The best feature at Looker is the way to can connect to multiple sources at once and create complex reporting and data analytics.”
PGPeter Gunn
Manager
Used for 1-2 years
We analyzed 263 verified user reviews for Looker to find out what actual users really think.
Data management
Users appreciate Looker's integration with multiple data sources, allowing them to connect and analyze data from various platforms seamlessly. They find the tool invaluable for generating insights and making data-driven decisions, enhancing their overall analytics experience. Additionally, Looker is praised for its accessibility to non-technical users, enabling them to explore and utilize data without needing advanced technical skills.Dashboard creation
Users find Looker highly effective for creating dashboards from scratch, appreciating its straightforward and customizable approach. They value the ability to tailor dashboards to specific needs, making it a versatile tool for various reporting requirements. Additionally, Looker's user-friendly interface simplifies the process of building and managing dashboards, even for those new to the platform.Reporting
Users commend Looker for its robust reporting capabilities, particularly the ease of sharing and exporting reports. They appreciate the ability to track KPIs and create complex reports that provide valuable insights. Overall, Looker's data visualization and reporting features are highly regarded, making it a powerful tool for monitoring and analyzing business metrics. - Screenshots


Best Ease of Use


Based on our analysis of manufacturing BI tools with the most market demand, SAP Analytics Cloud is the highest rated for ease of use.
SAP Analytics Cloud provides what supply chain and logistics managers need to avoid unexpected, potentially crippling disruptions: real-time, digestible data on stockouts, shipping delays, and inventory levels. With simple data filtering and sorting capabilities, users can drill down into specific datasets—such as delivery times or vendor performance—on the go.
- Reviewers Perspective
“Excellent cloud analytics with live connections gives instant data fetch.”
KLKayla Lyne Cabati
SAP Security Analyst
Used for 1-2 years
We analyzed 117 verified user reviews for SAP Analytics Cloud to find out what actual users really think.
User interface
Reviewers find SAP Analytics Cloud’s user interface (UI) to be convenient and interactive, making it accessible for various business needs. They also appreciate the dynamic functionality and simplicity of the UI, which enhances their overall experience. However, some users also suggest that slight improvements to the GUI could further benefit all SAP users.Data visualization
Users find SAP Analytics Cloud helpful for automating data discovery, modeling, and visualization processes. They appreciate how the platform streamlines the collection, preparation, and visualization of data, aiding in informed business decision-making. The ease of working with data visualization on both web and mobile applications is also highlighted by users.Data management
Users appreciate SAP Analytics Cloud's powerful data integration features, enabling smooth connections to diverse data sources. They find that the platform greatly improves their data analysis procedures and aids in making well-informed decisions for various business initiatives. Additionally, the ability to present real-time data and create comprehensive reports is highly valued by users. - Screenshots


Best Customer Service

Tableau

Our analysis of manufacturing BI tools with the most market demand tools shows that Tableau is the highest rated for customer service.
Tableau serves users in industries such as financial services, industrial products, communications and media, and retail. It also provides manufacturing BI managers with in-app customer service channels and a comprehensive knowledge base. Tools such as dashboards, heat maps, and trend lines help identify patterns for expedited data-driven decisions. The tool’s drag-and-drop functionality also empowers users without technical skills to generate reports from complex data sets.
- Reviewers Perspective
“What I love about this platform is the ease of converting and analyzing data in a wonderful and clear way.”
FTFigo Tores
Security Monitor
Used for 2+ years
We analyzed 2,301 verified user reviews for Tableau to find out what actual users really think.
Report generation
Users commend Tableau's ability to create customized and automated reports, simplifying their reporting processes. They find the visual reports generated by the software to be polished and easy to share. Additionally, reviewers appreciate the report scheduling feature, which ensures their reports are always up-to-date without needing manual intervention.Visualization techniques
Reviewers find Tableau's user-friendly interface and diverse visualization options indispensable for business optimization. They appreciate the ability to create interactive visualizations that enhance data understanding and decision-making. Users also highlight the customizable visualizations, which allow them to tailor their data presentations to specific needs.Data analysis
Users appreciate Tableau's robust data connectivity, allowing them to link various data sources seamlessly. They find the platform's data manipulation and analysis capabilities highly effective for business insights. Additionally, reviewers highlight the software's compatibility with numerous data sources, enhancing their ability to perform comprehensive data analysis. - Screenshots


Best Functionality

Domo

Among the most popular manufacturing BI tools, Domo is the highest rated for functionality.
Domo offers data analysis tools for a variety of industries, including retail, tech, manufacturing, healthcare, life sciences, and more. Overall, it provides a comprehensive view of cross-departmental performance metrics on demand. This is possible due to built-in data ingestion, aggregation, visualization, reporting, and exporting capabilities. Domo also leverages automation tools that can trigger alerts based on predefined conditions, such as production delays and diminishing inventory levels—a crucial prerequisite for proactive decision-making.
- Reviewers Perspective
“Working with various data sources, scheduling pipeline updates and reports, setting up alerts, and managing data lineage is easy.”
MKMariia Kiiashko
Lead Software Engineer
Used for 2+ years
We analyzed 317 verified user reviews for Domo to find out what actual users really think.
Data management
Users appreciate how Domo simplifies data management by integrating various data sources, making it easier to conduct thorough data analysis. They find it efficient for combining data from multiple systems, enabling a unified view of operations and facilitating informed decision-making. Additionally, reviewers highlight the ease of managing data pipelines, scheduling updates, and setting up alerts, which enhances overall data handling capabilities.Data visualization
Reviewers find Domo's data visualization features highly effective, particularly for creating well-designed dashboards that present data from numerous sources. They value the extensive range of data connectors and the ease of building dashboards, which aids in quick and impactful decision-making. Users also appreciate the user-friendly interface that allows even non-BI experts to create and view dashboards effortlessly.Reporting
Users highlight the ease of report creation in Domo, noting that even those with basic tech skills can generate reports quickly. They appreciate the powerful report builders, which facilitate the creation of complex and customized reports to meet various business needs. Additionally, reviewers mention the increased productivity and ability to navigate and export numerous reports seamlessly. - Screenshots


Methodology
The research for the best manufacturing BI software list was conducted in November 2024. We evaluated data (user reviews and demand signals) from the past 24 months as of the research date. Read the complete methodology.
Popular Manufacturing BI Comparisons


Buyer's Guide
This detailed guide will help you find and buy the right manufacturing bi software for you and your business.
Last Updated on February 21, 2025Here's what we'll cover:
What you need to know about manufacturing BI software
What is manufacturing BI software?
Common features of manufacturing BI software
Benefits of using manufacturing BI software
How to choose the best manufacturing BI software for your business
Software related to manufacturing BI
More resources for your manufacturing BI journey
What you need to know about manufacturing BI software
Manufacturing business intelligence (BI) software is a system designed to provide real-time insights into production performance with detailed reporting dashboards. Analyzing data from various stages of production allows businesses to quickly identify bottlenecks, monitor quality control, and track key metrics. This leads to better decision-making and consistently meeting high consumer demand while maintaining product quality.
For example, businesses in the food and beverage industry can use manufacturing BI software to optimize efficiency, reduce waste, and ensure compliance with safety standards. It can also track detailed key performance indicators (KPIs) such as ingredient usage and yield.
Our experienced software advisor, Lindsay Robbins, shares an important note on what exactly BI software does and does not do:
“Some BI software buyers have a misconception that the tool will scrape or otherwise provide the data on its own, but this is not the case. BI software aggregates, analyzes, and graphically displays the data that you provide. So it’s important that manufacturers have good processes in place to capture data before implementing a new BI tool.”
To give you an idea of the market, we have over 190 different manufacturing BI products on our site, and we’ve published 1,383 reviews for 64 products in the past year alone. The majority of user reviews (57%) come from small to midsize businesses with 1,000 or fewer employees, and 43% of reviewers have over 1,000 employees. The largest industry represented is food and beverage (29%), followed by automotive (14%). [1]
Most BI software systems are priced on a ‘per-month’ basis. [2] Entry-level plans cost an average of $205 per month and offer basic features, such as performance metrics and dashboards for up to 10 users. Mid-tier and high-end plans cost an average of $1,507 - $7,988 per month and may include additional features, like ad-hoc reporting and data connectors to multiple sources. Keep in mind that manufacturing BI software may cost more than general BI software due to specialized features.
If you’re a first-time buyer, consider your budget, number of users, use cases, and necessary integrations. Consult stakeholders to gather questions you should ask vendors during an evaluation. Our software advisor, Isaac Routh, shares the following questions to get you started:
Is it possible to connect multiple data sources to the tool?
Does the system track the types of KPIs you require, such as performance and/or quality metrics?
Does the tool provide the visual analytics and dashboards your team needs?
Will you need a data scientist or other designated expert to maintain the system?
If you would prefer to speak with one of our experienced purchase order software advisors like Robbins or Routh, schedule a call or start a chat with us.
What is manufacturing BI software?
Manufacturing BI software collects data such as total units manufactured, the number of units sold, total shipments, and buyer demographics from a manufacturer's existing systems as well as from across the supply chain. The software then analyzes this data and provides actionable insights.
Manufacturing BI software allows manufacturers to make informed business decisions related to future sales strategies, materials management, and buyer targeting.
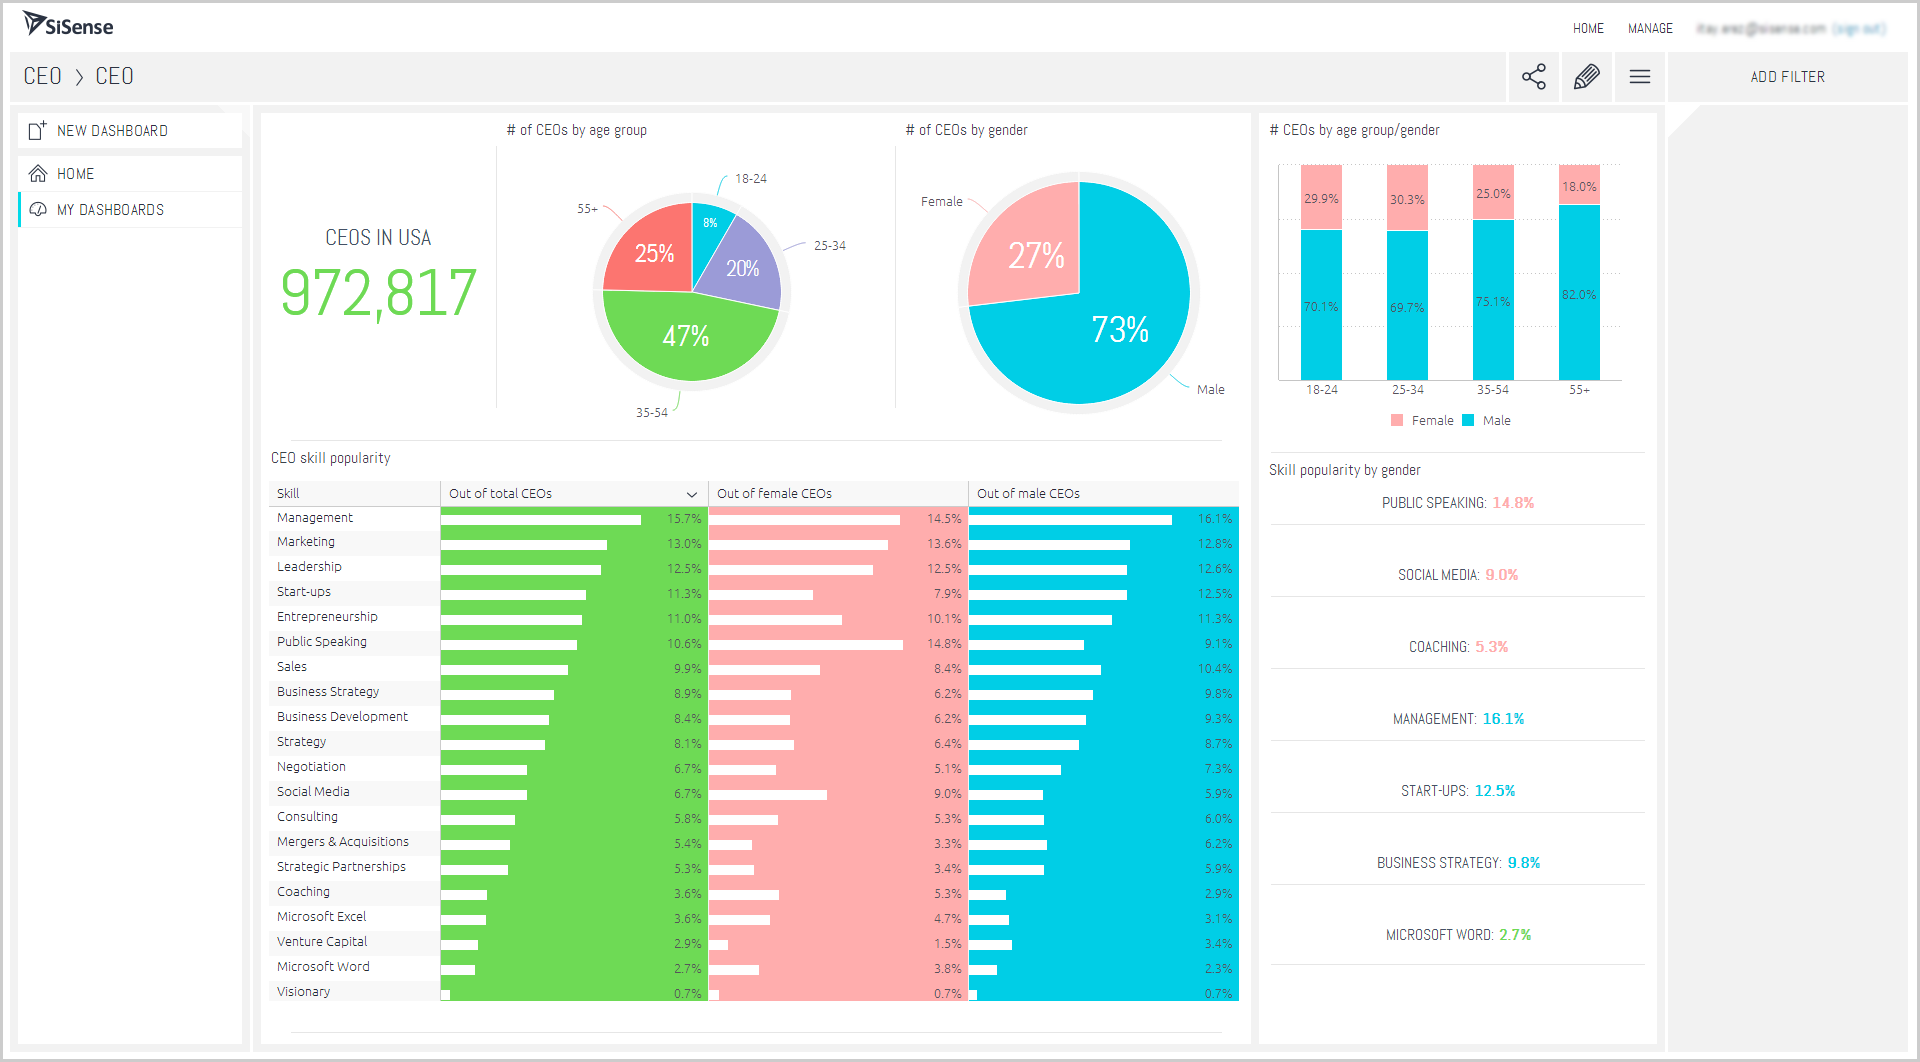
Analyze total sales, units sold, buyer demographics in Sisense BI
Common features of manufacturing BI software
Different vendors offer different features in their manufacturing BI software. Core features, like analytics, are present in every manufacturing BI tool while common features, such as data mining and predictive analytics, may or may not be offered by all vendors. Selecting the best manufacturing BI software for your setup is easier when you know what common features are and what they do.
Data mining | Scan through large volumes of data to identify previously unknown or new patterns. This is the fundamental step of business intelligence that other processes, such as predictive analytics, rely on. |
Predictive analytics | Forecast demand, predict customer behavior, and prepare strategies using statistical tools. |
Online analytical processing (OLAP) | Perform multidimensional analysis of large volumes of data. |
Dashboards | Highlight a manufacturing business's KPIs and focus on critical metrics. |
Data visualization | Create graphical representations of business data using simple user interfaces. |
Trend indicators | Identify patterns in production, sales, or distribution channels and refine your business strategy. |
Scorecards | Attach or assign a numerical weight to each KPI and then map its progress. For instance, a scorecard might assign an A+ grade to 40 percent annual revenue growth if the goal was set at 20 percent. |
To learn more about these features and manufacturing BI software vendors, schedule a call or start a chat with one of our experienced purchase order software advisors, like Robbins or Routh. They'll help you narrow down your options by listening to your requirements and recommending the best solutions for your business.
What type of buyer are you?
Before you evaluate manufacturing BI software options, you'll want to know which buyer category you belong to. We believe most buyers will fall into one of the below categories:
Small manufacturers: These businesses typically transition from pen and paper to more automated systems and only need basic BI functions such as data mining and predictive analytics.
Multi-location manufacturers: Operating multiple manufacturing units adds a layer of complexity to software requirements. These buyers need to understand customer demographics across locations and deal with large volumes of regional data. They may also require additional features such as data visualization and OLAP to analyze multidimensional data and create different graphical representations.
Large (enterprise) buyers: These buyers value the seamless integration of data and processes that comes from having a unified platform for all functions. They appreciate a full-featured solution and would do best to seek an integrated enterprise resource planning (ERP) suite that includes manufacturing management and BI applications, along with other applications such as inventory management, supply chain management, etc.
Benefits of using manufacturing BI software
While some of the benefits of manufacturing BI software may be clear from our discussion above, we've called out the most notable ones below:
Provides actionable insights: Manufacturing BI software provides insights related to manufacturing costs, raw materials usage, and shipment costs, using features such as predictive analytics and OLAP. Based on the insights, manufacturers can adjust their production strategy for higher profitability.
Improves forecasting and planning: Predictive analytics aids in anticipating future trends and demands, ensuring better resource allocation. For example, by analyzing historical sales data, manufacturers can predict peak seasons and adjust inventory levels accordingly to meet customer demand efficiently.
Increases operational efficiency: By analyzing production data, manufacturing BI software helps identify inefficiencies and areas for improvement in manufacturing processes. For instance, it can highlight machinery that frequently breaks down, prompting timely maintenance and reducing downtime.
Improves overall sales: Such software helps manufacturing units identify untouched markets, sales trends, and product improvements. These insights help teams improve their negotiation strategies with customers, suppliers, and vendors to improve total sales.
How to choose the best manufacturing BI software for your business
Step 1: Define your requirements
Before selecting a manufacturing BI software system, start by identifying your specific needs, such as the type of data you need to analyze, the scale of your operations, and the reporting capabilities required. These requirements will guide you toward a system that aligns with your current manufacturing processes and supports your long-term goals.
Consider factors like software functionality, budget, training assistance, data migration, and necessary integrations. Data migration from existing systems, such as ERP or supply chain management tools, can be a significant cost, so discuss these needs with vendors to ensure a smooth transition.
What is the cost of manufacturing BI software?
The price of manufacturing BI software varies depending on factors like the number of users, required features, and the complexity of data integration. However, many businesses budget for a subscription model priced on a ‘per-month’ basis. [2]
Entry-level plans cost an average of $205 per month and offer basic features, such as performance metrics and dashboards for up to 10 users. Mid-tier and high-end plans cost an average of $1,507 - $7,988 per month and may include additional features, like ad-hoc reporting and data connectors to multiple sources.
Integration considerations for manufacturing BI software
Integrations are crucial for ensuring that BI software can connect with your existing systems, such as enterprise resource planning (ERP) or customer relationship management (CRM) platforms, to centralize data. For example, integrating BI software with an ERP system can provide real-time insights into inventory levels and production schedules, helping manufacturers optimize resource allocation.
Be aware of potential drawbacks
While manufacturing BI software offers numerous benefits, there are potential challenges to be aware of:
Complexity: Some BI systems may have a steep learning curve, especially for users unfamiliar with data analytics. This can lead to underutilizing features and slow adoption, so comprehensive training and support are essential.
Data overload: With access to vast amounts of data, focusing on irrelevant metrics is risky. To avoid analysis paralysis, define key performance indicators (KPIs) that align with business objectives and assess them regularly.
Integration challenges: Not all BI software will integrate with existing systems, which can lead to data silos. It's important to make sure that the chosen tool can effectively consolidate data from various sources for comprehensive analysis.
Step 2: Make a shortlist of manufacturing BI software
With so many options available, creating a shortlist of BI software that meets your needs is essential. Consult with key stakeholders to develop a list of technical and business requirements. Then, compare vendors on our site, read user reviews, and connect with an advisor like Robbins or Routh to help narrow down a final three to move forward with a detailed evaluation.
For more help creating a shortlist and a free, downloadable comparison chart, check out The Ultimate Software Vendor Evaluation Guide. This resource and the comparison chart will help you evaluate each vendor by assessing functionalities, training and support services, costs, and deployment options.
Step 3: Pick your best option
After narrowing down your options, schedule demos with vendors to explore features and ask questions. These sessions are crucial for understanding how the software can meet your specific needs.
How to prepare for vendor demos
Prepare a list of questions to ask during demos, such as:
How customizable is the software to fit our manufacturing processes?
What integrations does the software support with our existing systems?
How is ongoing support and training provided?
Analyst tip: Before the demo, provide the vendor with a sample of your manufacturing data and ask them to demonstrate how their software can analyze and report on it.
Step 4: Successful implementation of the new manufacturing BI software
Once you've selected and signed a contract for your new manufacturing BI software, it’s time to focus on a successful implementation strategy. The key elements are establishing clear communication plans, providing comprehensive training, and starting with a pilot project to test the software's capabilities.
Establish clear change management communication: Create a communication plan outlining the implementation process, benefits, and workflow changes. Ensuring all team members are informed and prepared for the transition will help make the adoption smoother.
Provide training and change support: Schedule training sessions to familiarize users with the manufacturing BI software's basic and advanced features. Ongoing support, including Q&A sessions, can help address concerns and ensure effective use of the new tool.
Start with a pilot project: Implement the new software on a smaller scale to test its performance and gather feedback. Use this phase to make necessary adjustments and demonstrate the software's value, encouraging broader adoption across the business.
Software related to manufacturing BI
Depending on which manufacturing BI tool you choose, you may need to supplement some features with related software systems to gather and analyze all business data. Some types of software that are closely related to manufacturing BI but may or may not be included in all systems include:
Business intelligence: A technology-driven tool that helps businesses collect, analyze, and visualize data to facilitate informed decision-making and strategic planning.
Dashboard software: Used to aggregate and visually display key performance indicators (KPIs) and data metrics in an interactive, easy-to-understand format, enabling users to monitor and analyze business performance at a glance.
Embedded analytics software: Integrates analytical capabilities directly into business applications, allowing users to access, analyze, and visualize data insights within their existing workflows without switching between separate platforms.
Heatmap software: Visually represents data using color gradients to highlight patterns, trends, and intensity levels, often used to analyze user interactions on websites or applications to improve user experience and design.
Risk management software: Designed to identify, assess, and mitigate potential risks within an organization, helping businesses to proactively manage uncertainties and minimize their impact on operations and objectives.
More resources for your manufacturing BI journey
About our contributors
Author
Olivia Montgomery is an associate principal analyst at Software Advice, covering program and project management with a focus on the strategic alignment of IT and operations to optimize digital transformation. Drawing from her experience as a former IT PMO leader and her background in humanities studies, Olivia delivers data-driven insights that empower business leaders to drive business growth through projects.
Olivia’s research and analysis is informed by nearly 200,000 authentic user reviews on Software Advice and over 10,000 interactions between Software Advice software advisors and project management software buyers. Olivia also regularly analyzes market sentiment by conducting surveys of project managers and PMO leaders so she can provide the most up-to-date and helpful information to small and midsize businesses purchasing software or services.
Her expertise is featured in Forbes, Bloomberg, CIO Dive, and TechRepublic, as well as in podcasts, such as The Digital Project Manager. Recently, she presented her research on emotional intelligence (EQ) and decision-making at PMI's Global Summit conference, shedding light on the crucial role of EQ in driving project success. When she's not analyzing tech trends, you can find Olivia horseback riding or re-watching Jurassic Park.
Editor
Mehar Luthra is a team lead at Software Advice and specializes in editing reports that cover the latest trends affecting small businesses. With nearly a decade of experience, she has edited a multitude of research articles, top-rated software reports, and thought leadership articles for diverse markets such as Brazil, Japan, Canada, France, Australia, and India. She finds it particularly rewarding to produce content that provides small-business owners with practical tips and helpful advice on topics such as the digitalization of small businesses, eCommerce trends, and HR developments.
Armed with a double bachelor’s in law (LL.B.) and business economics from Delhi University, she won a full scholarship to study for a master’s in creative writing at the National University of Ireland, Galway. In addition, she has written blog articles spanning a variety of topics such as fiction and non-fiction books, mental health and anxiety, the latest restaurants, and more. Her articles have been featured in Ireland’s national magazine The Village, among other publications. A die-hard journaling fan, she enjoys watching psychological thrillers, reading fiction books, and drinking iced coffee (even in the winter).
Advisors
Lindsay Robbins is a senior advisor. She joined Software Advice in 2023, and she is based in Austin, TX.
Lindsay works directly with small business leaders to connect them with best fit software providers. She assesses the technology needs of small businesses seeking manufacturing, business intelligence, inventory management, and ERP software through one-to-one conversations and provides a short list of potential matches.
Lindsay’s favorite part of being a software advisor is helping a wide range of buyers find the right software based on their unique needs.
Isaac Routh is an advisor manager. He joined Software Advice in 2020 as a software advisor, and now he manages a team of seven software advisors. He is based in Austin, TX.
Isaac and his team help small businesses find the right ERP, legal, business intelligence, and accounting software for their needs each year. They’re able to do this through one-to-one conversations designed to narrow down the list of potential tools to only those that are the best fit.
His favorite part of being a Software Advice advisor team manager is educating buyers and supporting small business owners.
Sources
Software Advice advisor call notes: Findings are based on data from telephonic conversations that Software Advice’s advisor team had with businesses seeking BI tools. For this report, we analyzed phone interactions from December 12, 2023, to December 12, 2024. Read the complete methodology.
Software Advice software pricing data: Only products with publicly available pricing information and qualified software products within the category, as of January 2024, are included in the pricing analysis. Read the complete methodology.
Manufacturing BI FAQs
- What is business intelligence in manufacturing?
Business intelligence (BI) in manufacturing is data analysis software that provides insights and reporting, enabling more informed decision-making. Manufacturing BI software is used to help track and report on key metrics and performance indicators, specifically within manufacturing operations. The tool’s dashboards and insights can help manufacturers identify bottlenecks, reduce costs, and streamline processes across the supply chain.
- What are the four types of business intelligence?
The four types of business intelligence (BI) are descriptive BI, which analyzes past data to understand what happened; diagnostic BI, which investigates why something happened; predictive BI, which forecasts based on historical data; and prescriptive BI, which recommends actions to optimize outcomes. Manufacturing BI software is used to help track and report on key metrics and performance indicators in manufacturing businesses.
- What are the 5 types of software used in manufacturing?
Manufacturing uses five main types of software including, 1) Enterprise resource planning (ERP) for overall management, 2) Manufacturing execution systems (MES) for real-time production tracking, 3) Product lifecycle management (PLM) for design and development, 4) Computer-aided design (CAD) for product modeling, and 5) Supply chain management (SCM) for coordinating logistics. Each type enhances efficiency, quality, and communication across the production process.
- Which is the best BI software?
For manufacturing business intelligence, our analysis of products with high market demand finds Phocas software had the highest overall rating from verified reviewers on Software Advice. However, the best business intelligence (BI) software depends on your specific needs, such as the size of your business, the complexity of your data, and the features you’re looking for.
- What is the most commonly used BI tool?
Of the over 190 manufacturing business intelligence (BI) products available on our site, Google Analytics 360 has the highest number of verified user reviews on Software Advice in the past year, which suggests it's commonly used and trusted by many businesses for analytics.